
Weekly Special | May 15, 2023
Inflation Slows Housing Market Recovery
The graph in today’s report explains why the US is not building homes at a rate sufficient to keep prices from running away.
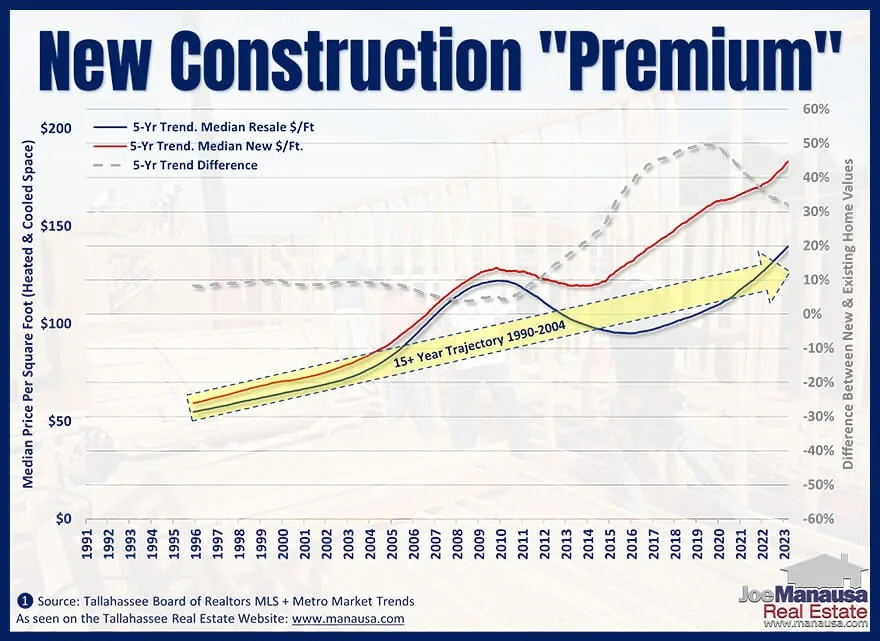
The red line plots the five-year average of the median price per square foot of new homes, while the blue line plots the five-year average of the median price per square foot of existing homes. The gray line measures the “premium” that new home buyers pay to be the first to own a home. This gray line explains why new home construction is not happening in America.
For the twenty-two (22) years ending in 2012, the difference between the cost of new and existing homes was typically just under 10%. This means that a new home that was valued at $100 per square foot in 1995 would be the same size as an existing home valued at $90 per foot. Generally speaking, speculative builders had little risk if they were building quality homes, as “brand new” was only 10% more expensive than “used.”
With a relative abundance of shelter in America, the spread between new and used was pretty tight. But then the federal government got involved as it felt the need to crash the housing market (which is how the “one-trick pony” Fed fights inflation).
The cost of new homes soared while the value of existing homes was still reeling from 2007. The ten percent differential between new and used homes reached as high as 81% in 2015; now builders are being cautious and building at lower than historically normal rates.
The original one-page Weekly Special PDF is still available.
Get the Weekly Special Every Monday
Each Monday morning the Weekly Special takes one Tallahassee housing question, answers it with a chart of local sales, and explains what it means for your next move.
It is free, and you can unsubscribe any time.