
Weekly Special | October 24, 2016
Slow Down Reported In Year Over Year Home Sales
Two of the past three months have seen fewer sales than in the same months in 2015.
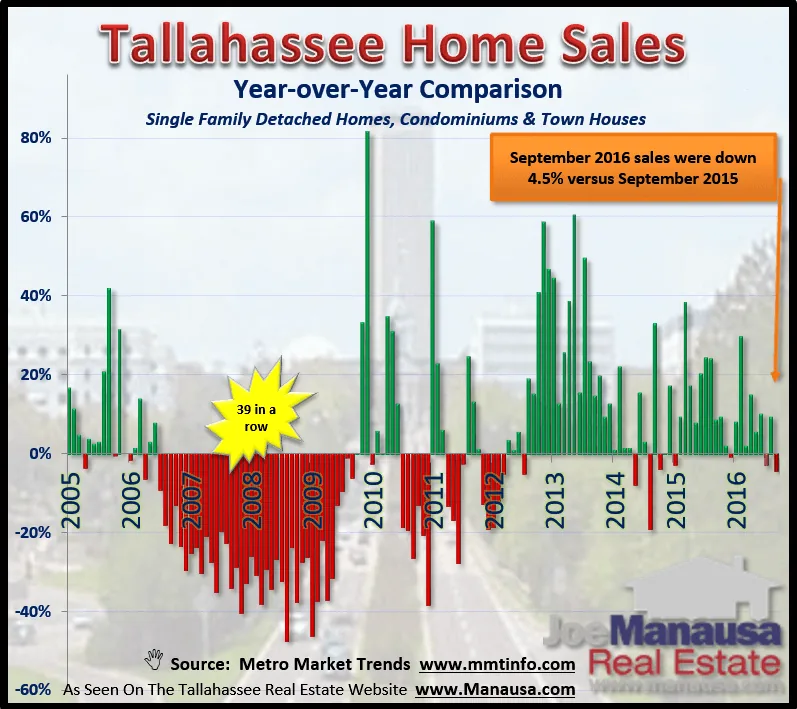
In the graph above, we measure the number of home sales each month and compare it with the same month from the previous year. The percentage change is then plotted for each new month.
We use a “Year over Year” analysis to demonstrate the strength of the housing market as it removes the seasonal effects that we observe when moving from one time of year to the next.
If the line projects upwards (green), the month from the current year produced more home sales than the same month from the previous year, while a downwards plot (red) is reporting fewer sales.
Home sales in September were 4.5% lower than the number of homes sold in September last year. July also reported a decline.
Fortunately, when we look at the past three months collectively, the market is up a little less than 1% over the same three months in 2015.
Make no mistake about it though, the market is cooling off as the number of buyers is declining. Based upon the current pace of current home sales in the MLS, it appears as if the final quarter of 2016 will be slower than the final quarter of last year.
The original one-page Weekly Special PDF is still available.
Get the Weekly Special Every Monday
Each Monday morning the Weekly Special takes one Tallahassee housing question, answers it with a chart of local sales, and explains what it means for your next move.
It is free, and you can unsubscribe any time.