
Weekly Special | October 9, 2016
The New Normal Is Abnormal!
The strong housing market recovery continues in Tallahassee with a eighth consecutive month of selling more homes from inventory than what is considered “normal.”
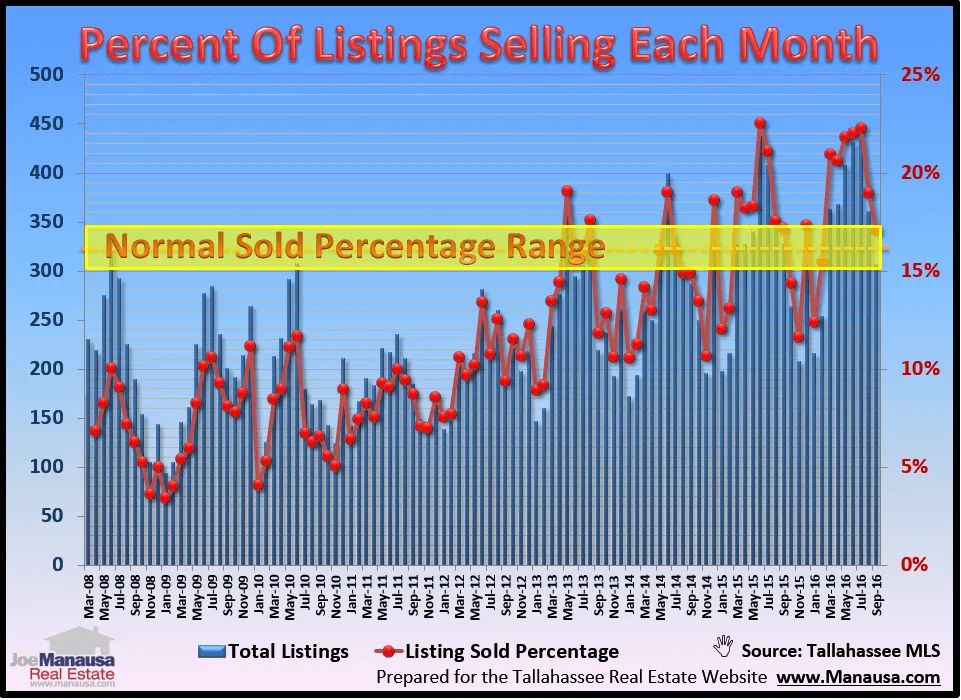
I use the word “normal” as it relates to a balanced market. Six months of supply is the amount normally identified as a balance between sellers and buyers (also referred to as market equilibrium).
Whenever more than 1/6th of the inventory is sold in a month, we typically see declining supply and strengthening in home values.
The graph above shows the number of listings for sale in the Tallahassee MLS each month (blue columns measured on the left vertical axis), as well as the ratio of listings that sold each month (red line, measured on the right vertical axis).
The yellow band marks the “normal” zone for this ratio of listings that sell each month, meaning if the market has a normal balance between supply and demand, and no seasonal factors are in place, we should see the red dots each month fall within that yellow band.
Of course, we have seasonality in Tallahassee, meaning that we see more homes sold during the warm months than we do the cooler months. Thus we would expect to see red dots within the yellow band and above it during the warmer months, and at or below the yellow band during the cooler months.
Thus far in 2016, we’ve had 8 out of 9 (January was seasonably low) months sell at or above the normal range.
Because of this, inventory is declining in almost every price range (top end is still glutted as new construction has countered declining inventory) and we will see values continue to rise for the foreseeable future.
The original one-page Weekly Special PDF is still available.
Get the Weekly Special Every Monday
Each Monday morning the Weekly Special takes one Tallahassee housing question, answers it with a chart of local sales, and explains what it means for your next move.
It is free, and you can unsubscribe any time.