
Weekly Special | February 7, 2016
Supply & Demand Differs Across Price Ranges
The supply and demand for homes in Tallahassee is far more balanced than we have seen in more than 8 years.
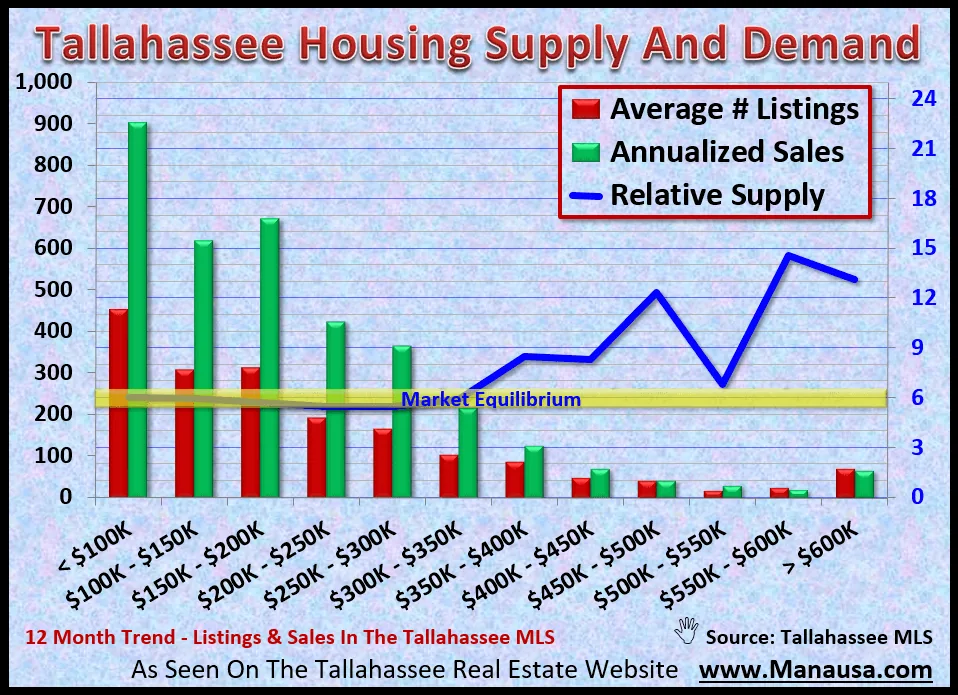
The glut of homes at all price ranges has shifted to where the glut only exists for homes valued in the top 10% of the market ($350,000 and up).
The graph above compares the average number of homes listed for sale over the past year (red bars) with the average number of homes that have sold (green bars) over the past year. The resulting blue line measures the months of supply of homes in each price range (shown on the right vertical axis).
By looking at a full year’s worth of information, we’ve removed the impact of seasonality which normally skews the appearance of inventory to the low side at this time of year.
Right now, the market is balanced below $350,000, and one could argue that homes valued from $200,000 to $300,000 are approaching a seller’s market.
It’s also important to note that this graph includes all of Leon County, so this should not be interpreted as the market situation in each part of the Tallahassee real estate market.
Some areas are performing better than what we see here (North and East), while other areas are under performing when compared to the graph (South and West).
If you are planning a move, whether you are selling your home, buying one or both, make sure you work with somebody who has the market expertise to guide you when pricing property.
The original one-page Weekly Special PDF is still available.
Get the Weekly Special Every Monday
Each Monday morning the Weekly Special takes one Tallahassee housing question, answers it with a chart of local sales, and explains what it means for your next move.
It is free, and you can unsubscribe any time.