
Weekly Special | January 31, 2016
2015 Wrap-Up Shows Buyer Hot Spots
The landscape for hot homebuyer activity has been evolving lately in the Tallahassee real estate market.
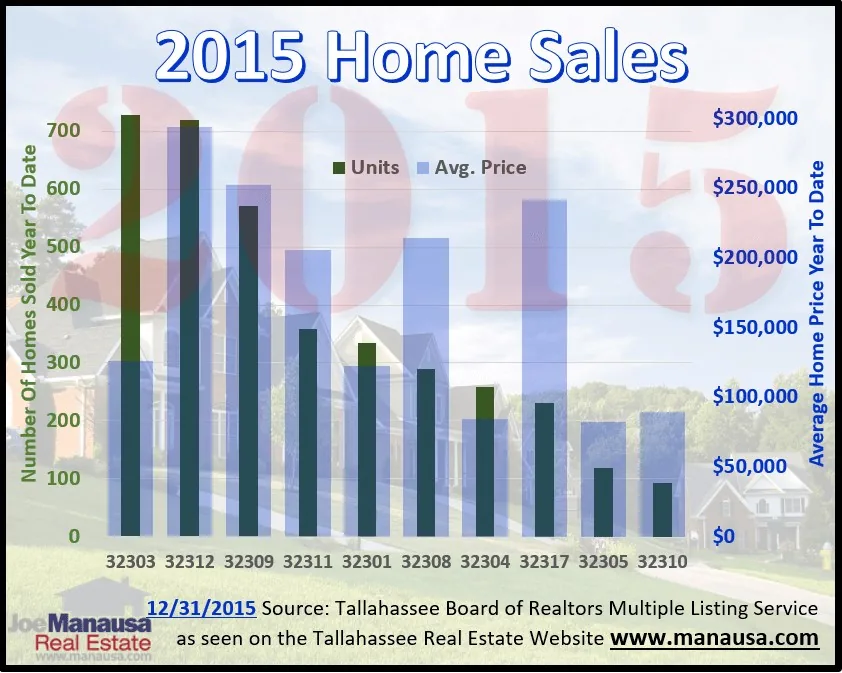
Zip codes located West of Tallahassee and South of Tallahassee are finally starting to heat up, as low home prices are pulling buyers in their direction.
Currently, there are ten active zip codes in the Tallahassee housing market. They are positioned left to right in the graph above from most active to least active.
The green vertical bars record the total number of homes sold year to date (recorded on the left vertical axis), while average sales prices are shown in light blue and recorded on the right vertical axis.
The 32304 zip code grew by more than 50% while the 32310 zip code grew by 15%. These West side zip codes have been relatively inactive in recent years.
It’s no surprise that the North side of town was strong in 2015. The 32309 zip code grew by 27%, while 32312 and 32317 grew by 20% and 15% respectively.
The 32303 zip code was the most active, but it saw year over year growth of only 8%.
The only zip code that reported declining sales in 2015 was the 32301 zip code, where it’s downtown neighborhoods reported 15% fewer sales than what was recorded in 2014.
The original one-page Weekly Special PDF is still available.
Get the Weekly Special Every Monday
Each Monday morning the Weekly Special takes one Tallahassee housing question, answers it with a chart of local sales, and explains what it means for your next move.
It is free, and you can unsubscribe any time.