
Weekly Special | September 28, 2015
Odds Are Good For Selling Home In October
Seasonality is a factor for home sellers to consider, as the housing market has shown a tendency to rise and fall fairly consistently with the changing seasons each year.
But the impact of these seasonal changes is far less significant for home sellers than one might imagine when only viewing annual home sales figures.
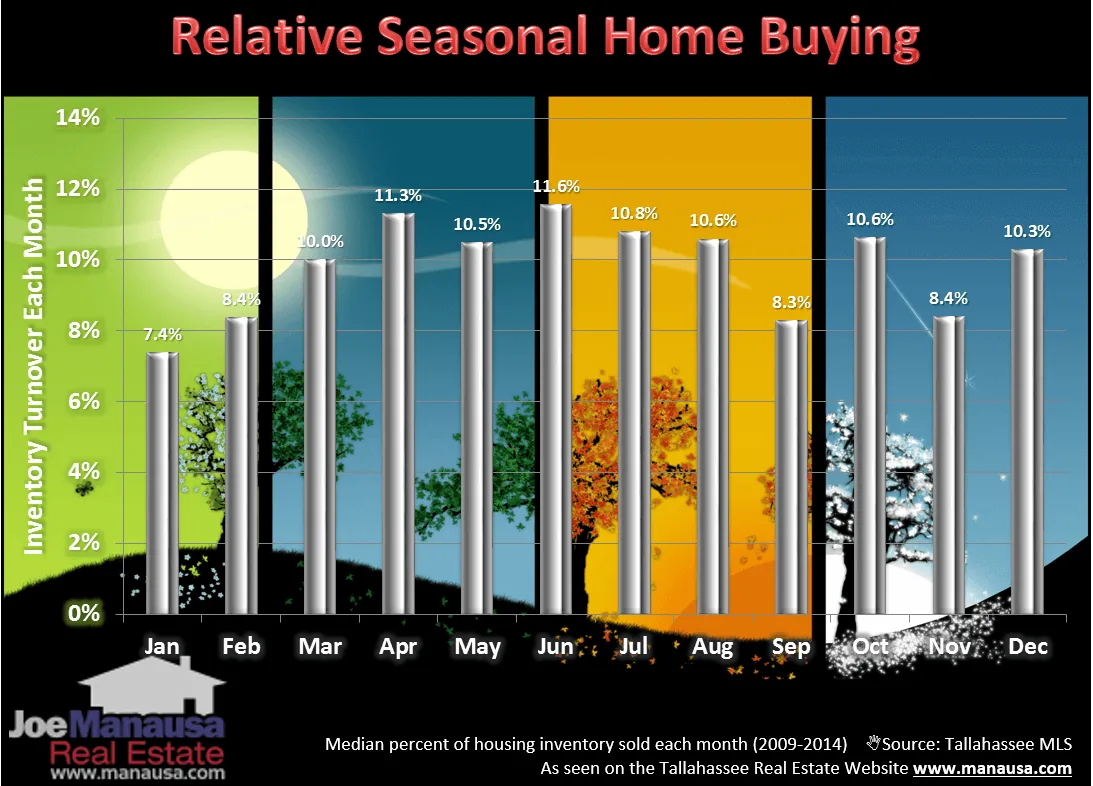
For example, the graph above shows the percentage of existing inventory that went “under contract” each month from 2009 through 2014.
I examined all homes that were listed during that time and compared it with the contracts that eventually closed from each month.
For example, if there were 2,000 listings in January 2011 and 200 closings eventually occurred from contracts written in January 2011, then I would record the fact that 10% of the inventory went under contract. This was done for each month from January 2009 through December 2014, and the median of these results were used to create the graph above.
Apparently, There are four months of the year where we typically see a decline in inventory turnover (the percentage of homes on the market that go under contract), and they occur from September though February.
But October and December stand out as months where home seller’s have the same odds of selling as they do in summer months.
The original one-page Weekly Special PDF is still available.
Get the Weekly Special Every Monday
Each Monday morning the Weekly Special takes one Tallahassee housing question, answers it with a chart of local sales, and explains what it means for your next move.
It is free, and you can unsubscribe any time.