

Weekly Special | February 6, 2023
2023 Real Estate Seasonal Forecast
Seasonality in real estate, it’s the ebb and flow of buyers and sellers in the housing market each year. There are times of year for each local housing market that are stronger than others.
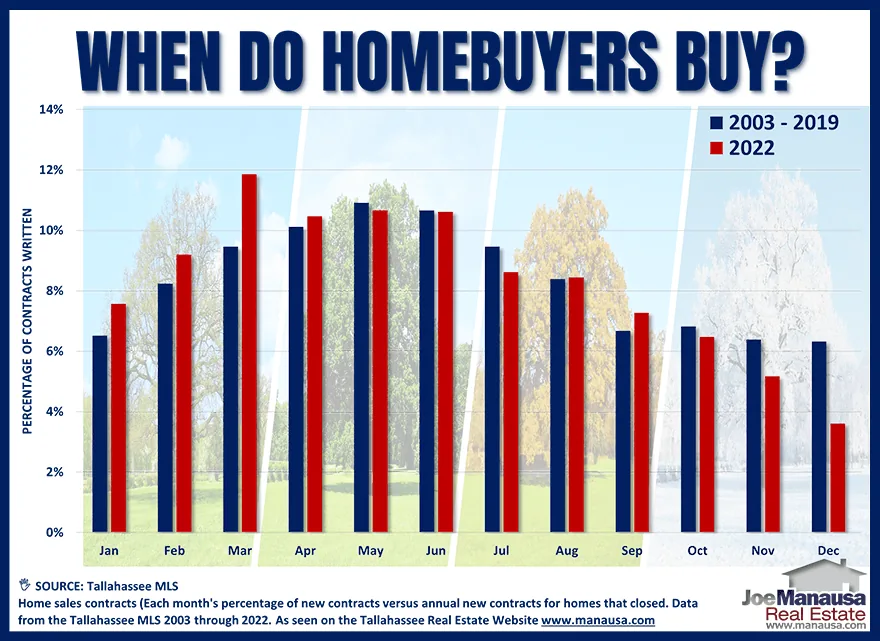
In Tallahassee over the past 25 years, we’ve seen roughly 60% of the homes sold during the six months from March through August, while the other six months only hold 40% of the sales.
For most years, you can pretty much expect these patterns to repeat, and I’ve often successfully forecast home sales for the year and come very close with my monthly totals.
The blue bars in the graph above report the percentage of annual contracts written each month for the years from 2003 through 2019, while the red bars report the same for 2022. Last year was very different from normal.
The first quarter is usually the slowest quarter of the year, but in 2022, with sub 3% mortgage interest rates, the first quarter was its strongest. Overall, March was significantly stronger than normal while November and December were significantly weaker.
2023 Seasonal Forecast We are expecting 2023 to follow traditional seasonal norms this year, as the outlook for mortgage interest rates and the economy is such that we’re not expecting a major direction change in the middle of the year.
Buyers will become more active at mid–month with contracts accelerating into June. Sales will be fewer than normal, but they will be on schedule.
The original one-page Weekly Special PDF is still available.
Get the Weekly Special Every Monday
Each Monday morning the Weekly Special takes one Tallahassee housing question, answers it with a chart of local sales, and explains what it means for your next move.
It is free, and you can unsubscribe any time.