
Weekly Special | February 13, 2023
Is Premium For New Construction Too High?
Over the past eight years, existing home values have increased at an average yearly rate of 7.4%, while new home values have risen at a yearly rate of 4.5%. This has caused both values to converge slightly.
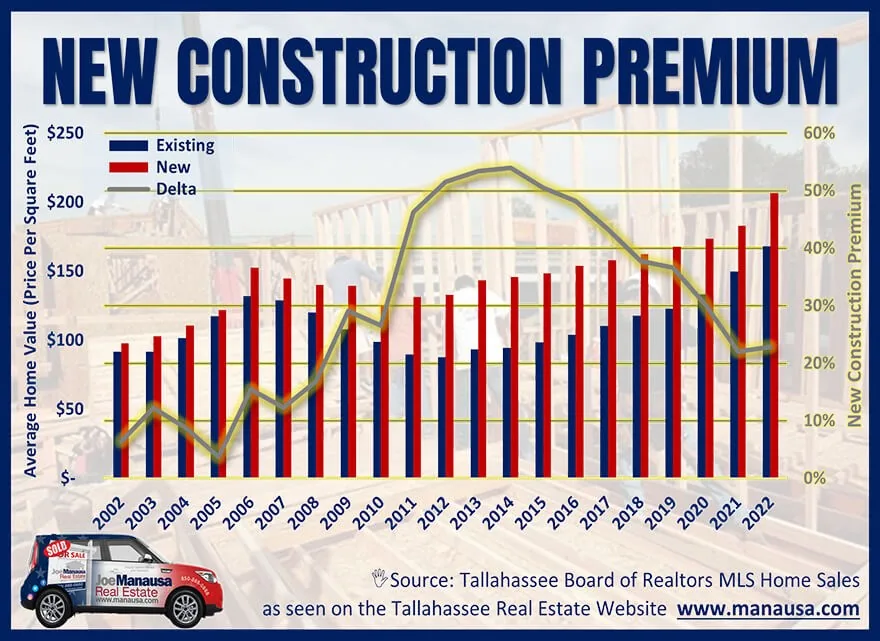
Today’s graph helps measure the “premium” that buyers pay to purchase a brand new home. The average value of new homes (in terms of price per square foot) is depicted in red, and the average value of existing homes is shown in blue. The difference between the two is plotted in gray and is displayed on the right vertical axis.
The data indicates that the gap between new and existing home values has reached its lowest point in thirteen years, with new homes becoming more affordable relative to used homes since 2011. But the difference remains far too great.
In the past, the difference between new and existing home values was less than 10%, which is a stark contrast to the present day. The cost of new construction has risen significantly due to factors such as increased construction costs, supply chain disruptions, labor shortages, minimum wage hikes, and a limited supply of affordable land.
This has resulted in housing scarcity, leading to the rapid appreciation of existing homes.
The current market conditions differ from the housing bubble of 2006, when an abundance of speculators flooded the market, leading to a supply surplus.
The original one-page Weekly Special PDF is still available.
Get the Weekly Special Every Monday
Each Monday morning the Weekly Special takes one Tallahassee housing question, answers it with a chart of local sales, and explains what it means for your next move.
It is free, and you can unsubscribe any time.