

Weekly Special | August 10, 2020
New Contracts Reveal Appreciation Explosion
Today’s graph tracks new contracts, specifically the average home value in 2020 each month and compares it with home values during the same months in 2019.
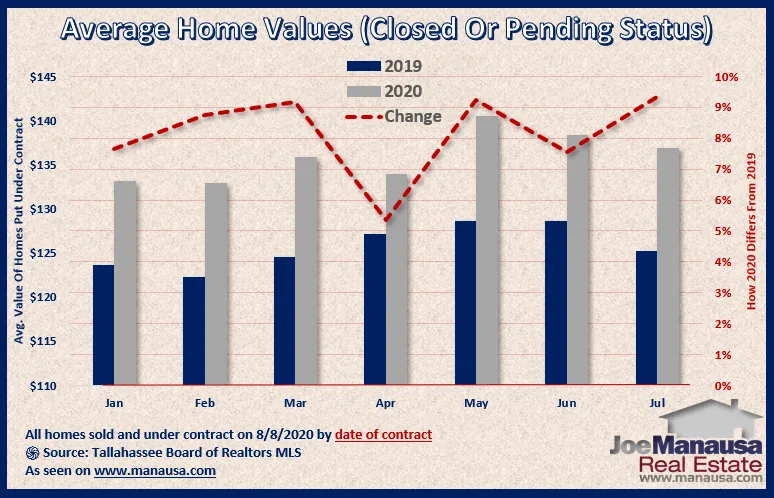
It shows that the appreciation rate each month has ranged from as high as 9.3% to as low as 5.3%, with year over year value change in July reporting the highest of the year, at 9.3% higher than June of 2019.
As reported in numerous other market updates, we continue to see low inventory levels in most areas and price ranges below $500K, and this is the biggest contributor to the accelerated appreciation rate.
Currently, the median appreciation rate in Tallahassee is right about 1% per month, which if it continues would be the highest rate I’ve ever seen in nearly 30 years selling homes in Tallahassee.
Why Track Pending Home Sales?
Our long-time subscribers have not seen me address pending home sales in many years, primarily because of the inaccuracies that spew from our MLS.
But change is rampant right now, and nothing gives you an earlier look at market behavior than do pending home sales. New contracts are the newest information we can get.
Each month, I spend hours preparing and then publishing a pending home sales report and an accompanying video. You can view the August report by clicking this link.
The original one-page Weekly Special PDF is still available.
Get the Weekly Special Every Monday
Each Monday morning the Weekly Special takes one Tallahassee housing question, answers it with a chart of local sales, and explains what it means for your next move.
It is free, and you can unsubscribe any time.