

Weekly Special | August 3, 2020
18 Years Of Home Prices Compared
Today’s graph shows us what people are paying for homes in Tallahassee in 2020 compared with 2002.
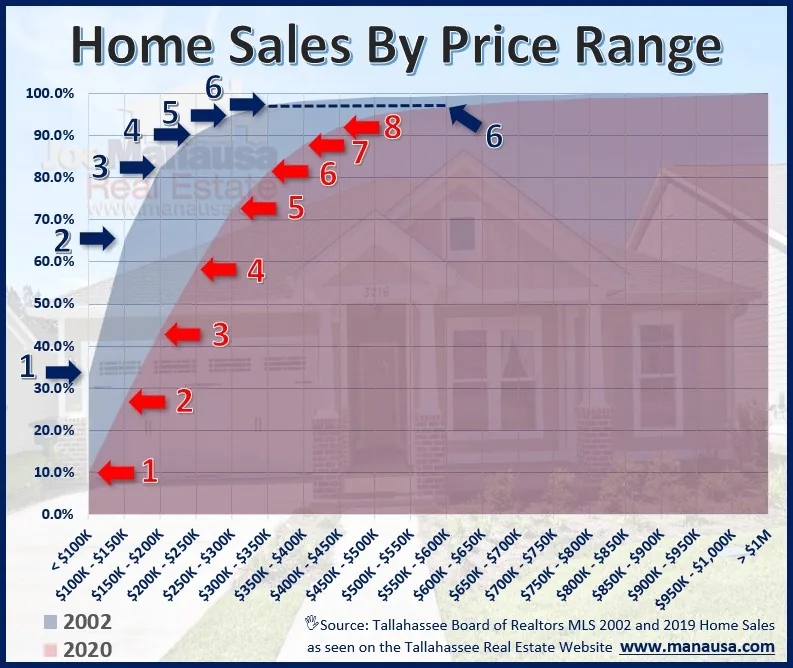
The area shaded in blue plots homes sold in 2002 while the area shaded in red plots 2020 home sales. Each price range of the homes sold are measured on the horizontal axis, while the percentage of all homes sold is measured on the vertical axis.
To say that home prices have risen in 18 years is a gross understatement.
Home affordability at all levels is being threatened, and the foreseeable future only shows home prices rising faster.
A few interesting facts from the graph:
33% of homes were less than $100K then versus 10% of homes now.
66% of homes were less than $150K versus 26% of homes now.
The “blue” 6’s show that the top 3% of buyers paid more than $350K then versus today’s top 3% pays more than $600K.
With low inventories and strong demand, expect home prices to continue to grow at alarming rates.
The original one-page Weekly Special PDF is still available.
Get the Weekly Special Every Monday
Each Monday morning the Weekly Special takes one Tallahassee housing question, answers it with a chart of local sales, and explains what it means for your next move.
It is free, and you can unsubscribe any time.