
Weekly Special | June 10, 2019
New Home Sales Rising From Bottom
Ask any homebuilder, the past ten years have been tough. When the market collapsed, the collective question among them was “when will things get back to normal.”
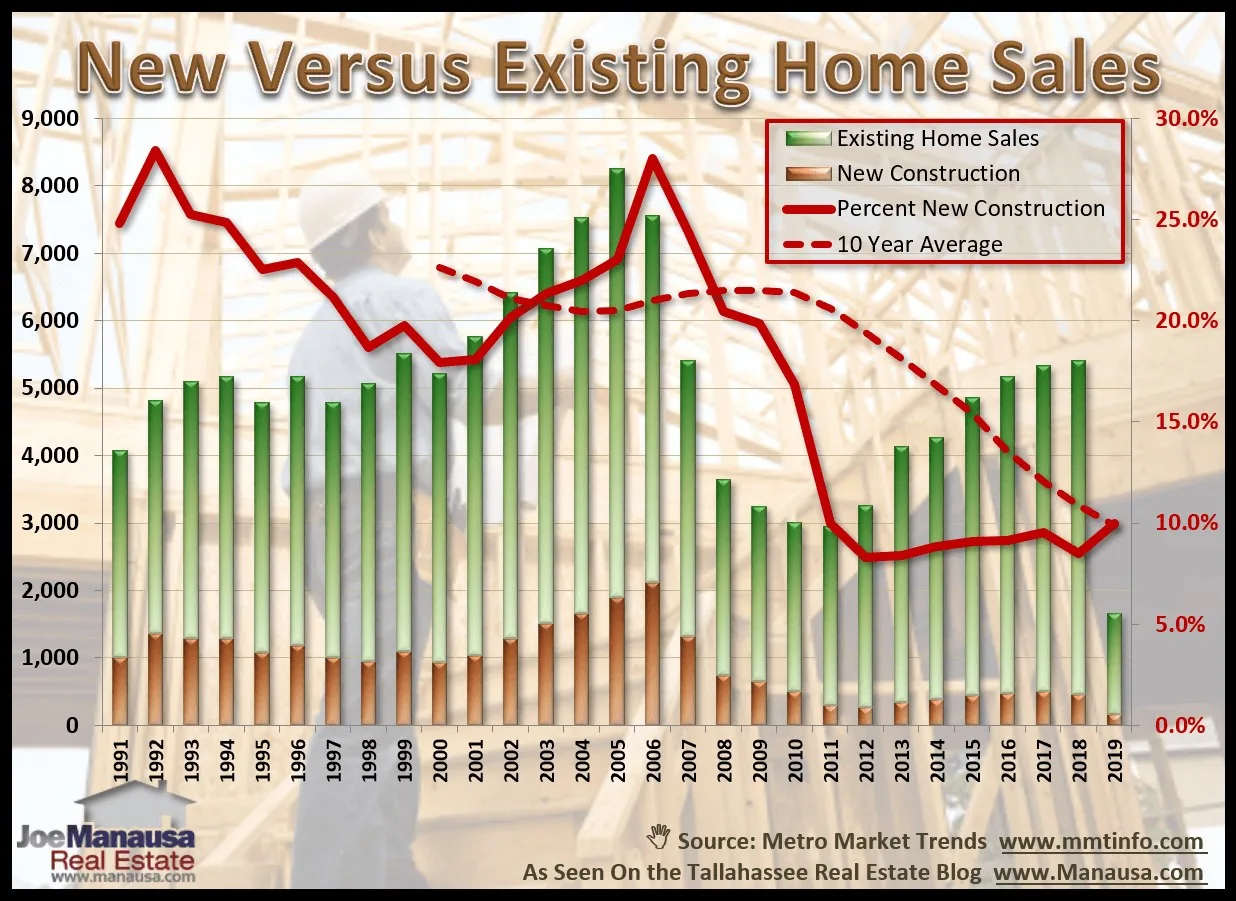
My answer ten years ago was that we had a long way to go. Tallahassee was grossly over-built and over-developed for residential lots that the recovery was likely going to take us into the early 20s for supply and demand to stabilize. My forecast was not well-received by the women and men who build homes for a living.
But here we are, on the doorstep of the next decade and new home sales remain at a historically low level. The graph above shows that new home sales are the best we have seen (as a percentage of the total housing market), yet that level is less than half of the “normal” that homebuilders long for.
Housing Market: New Homes Share Here’s what a historical analysis of home sales tells us about the percentage of new homes versus the entire market:
• 1990s: 23.1% (~ 1 in 4 homes sold)
• 2000s: 21.5% (~ 1 in 5 homes sold)
• 2010s: 9.9% (~ 1 in 10 homes sold)
Has the turn begun?
This year, new home sales are up 20% over the same period last year, so right now things are looking up for home builders. The supply of homes for sale at lower price ranges remains low, so I’m optimistic that this growth can continue upwards so long as home builders monitor and respect market demand.
The original one-page Weekly Special PDF is still available.
Get the Weekly Special Every Monday
Each Monday morning the Weekly Special takes one Tallahassee housing question, answers it with a chart of local sales, and explains what it means for your next move.
It is free, and you can unsubscribe any time.