
Weekly Special | June 17, 2019
Homes Are Selling Earlier Than Normal
We have been observing a change in seasonality for the sale of homes in Tallahassee during the past five years. While this may not be a big deal for some, it certainly impacts the budget for real estate agents and brokerages.
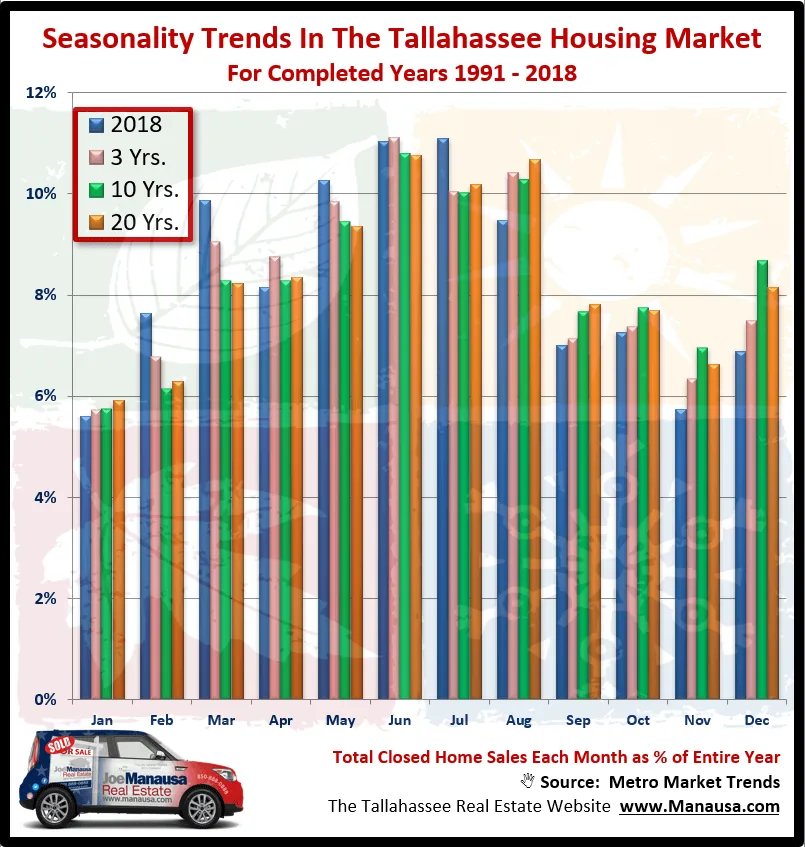
The graph above shows each month of the year and records for each the month’s closings as a percentage of all closed homes in the year. The blue bars show 2018, while the rest show the averages (3 years, 10 years, and 20 years). Here’s what I take from this:
February through August are reporting increased share of the year, while September through January are reporting declines. This means that sales are kicking off earlier each year (January sales become February closings) and are cooling off earlier as well.
I suspect that reduced inventories combined with modern digital marketing are resulting in quicker sales, so the people hitting the market in January who traditionally looked for a Spring closing are instead finding a February or March closing.
The original one-page Weekly Special PDF is still available.
Get the Weekly Special Every Monday
Each Monday morning the Weekly Special takes one Tallahassee housing question, answers it with a chart of local sales, and explains what it means for your next move.
It is free, and you can unsubscribe any time.