
Weekly Special | August 29, 2022
High “Premium” For New Construction
Homebuilders are having a hard time delivering homes to the market at prices people can afford today.
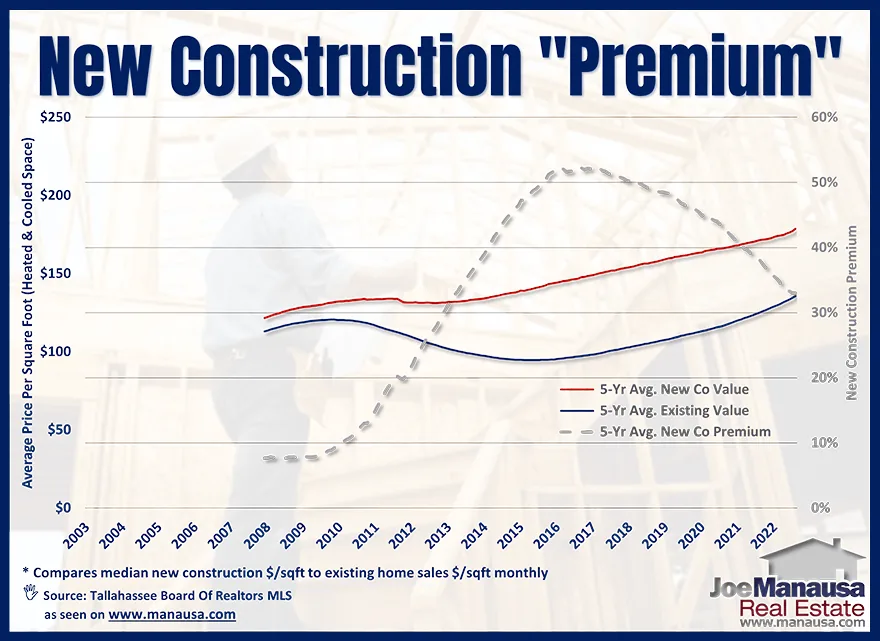
This graph plots the monthly median price per square foot of both new and existing homes, calculates the difference between the two (the new construction “premium” that buyers pay to get a new home), and then converts them to five-year trend lines.
It starts with data from 2003 and shows the new construction premium has jumped from an average below 10% to as high as more than 50% back in 2016. When I looked back to dates before this graph, the premium was typically in the 5 to 15% range. Today, the five-year trend has dropped to 32%.
The combination of wage growth and the COVID related supply disruptions have made homebuilding very expensive. We might see some relief from material costs, but as one local builder pointed out “we won’t see labor costs come down. In fact, they are soaring.”
One must remember that increased labor costs impact all material costs, including the transportation of those materials. Additionally, the cost of land is moving higher, too, as NIMBYism (see video) is making it so difficult to get new homes developed today.
The inventory of homes in the US has not kept up with population growth, and thus the new homes coming to the market will be at prices much higher than before. So long as the inventory shortage remains, we expect the upward trend to continue.
The original one-page Weekly Special PDF is still available.
Get the Weekly Special Every Monday
Each Monday morning the Weekly Special takes one Tallahassee housing question, answers it with a chart of local sales, and explains what it means for your next move.
It is free, and you can unsubscribe any time.