
Weekly Special | September 5, 2022
Median Home Value Pushes Higher
My primary method for measuring appreciation in the housing market is to evaluate the change in the median existing home value (price per square foot of the median existing home over time).
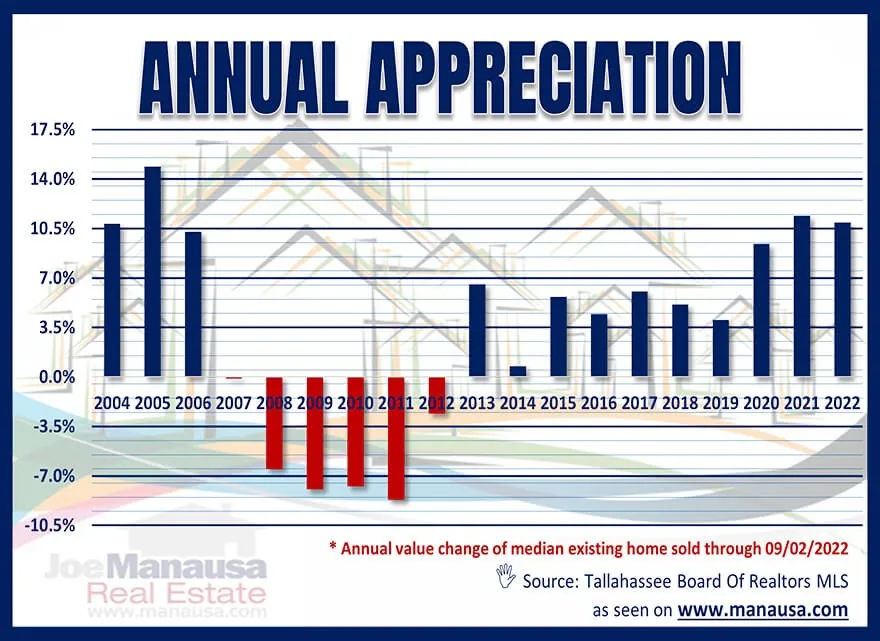
This graph plots the median existing home value each year and reveals the impact that the diminished inventory of homes for sale is having on home values. The market has been undersupplied since the end of 2016, so home values continue to move higher at an alarming rate.
Prior to 2021, I forecast double digit appreciation, and regrettably, the market met my expectation. The demand for homes has declined due to the rise in mortgage interest rates since the start of the year, but demand is still far stronger than the supply of homes can serve.
The blue bars in the graph above show that our local appreciation rate is far above normal, with this year’s rate of 10.9% through eight months already approaching last years 12-month rate. If the growth rate continues, we’ll see 2022 end at the highest growth rate on record at more than 16%!
We continue to find the number of new construction homes being built to be far lower today than what the market has consumed so the supply of homes is trailing demand. The lack of inventory will continue to increase the pressure on home values.
Rental rates are up the same as home prices, meaning there is no affordable alternative in renting versus owning.
The original one-page Weekly Special PDF is still available.
Get the Weekly Special Every Monday
Each Monday morning the Weekly Special takes one Tallahassee housing question, answers it with a chart of local sales, and explains what it means for your next move.
It is free, and you can unsubscribe any time.