
Weekly Special | April 13, 2020
Inventory Shortage Continues For Buyers
The listing and sales numbers have been posted for March, and the reduction of the supply of homes for sale continues to worsen.
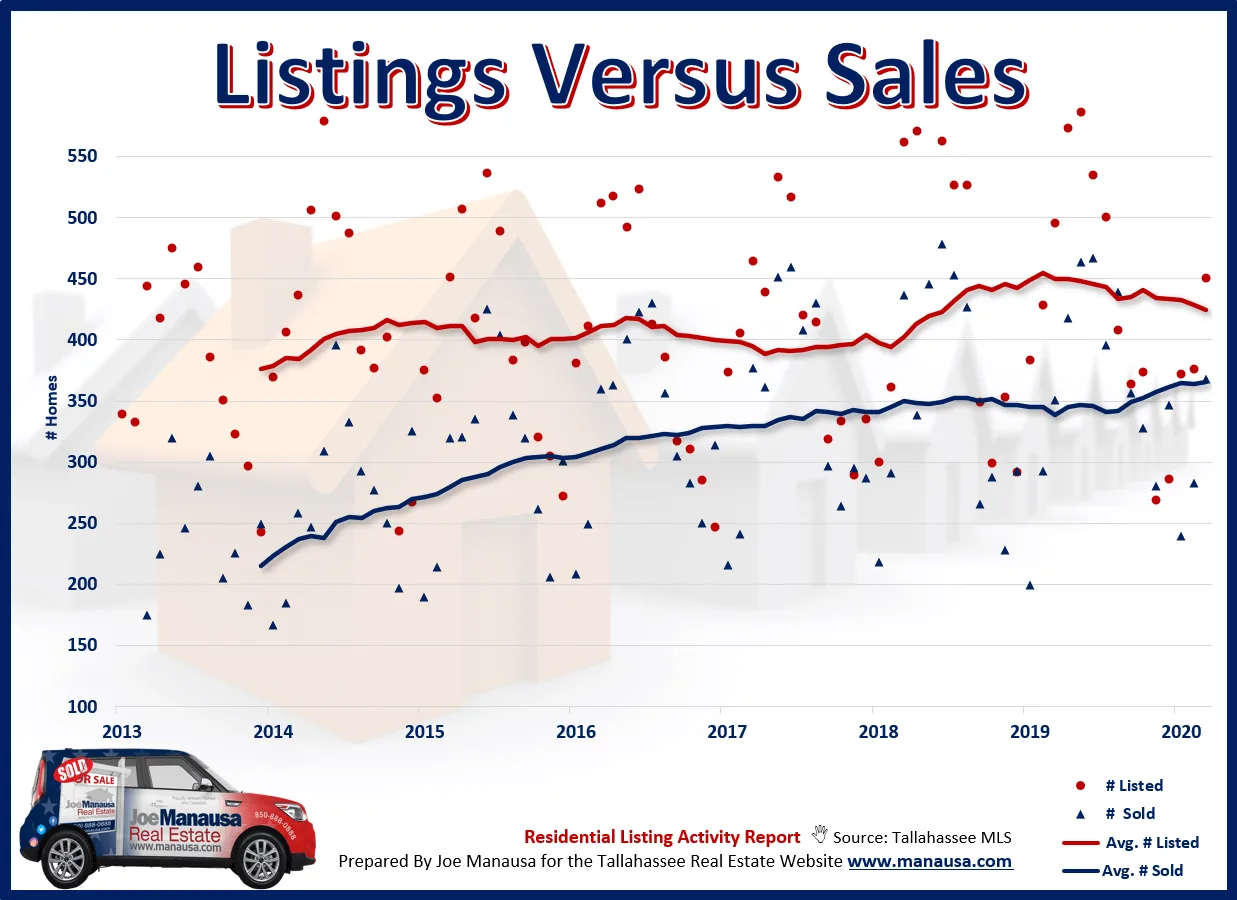
The graph above shows the number of homes listed each month (red dot)
and the number of homes sold each month (blue dot). The average or trend of each is shown as a solid line.
When we see the two lines diverge, it means that relative inventory is growing. Of course the opposite is true as the lines converge, meaning relative inventory is declining.
This back and forth between the relative supply of homes (the supply of homes relative to the current rate of demand) helps us prepare both sellers and buyers for what they will face in the near future.
Currently, we are seeing the strongest sellers’ market since the beginning of 2018, and recent months has seen the sellers’ market strengthen. Experience has taught us that for many price ranges, buyers are going to need to prepare for a bidding war. For those that choose to wait, they should expect much higher prices.
The number of fresh new listings in March was down nearly 20% versus last March, possibly due to the pandemic. Homeowners who had planned on moving need to know that buyers are out there waiting for your home right now.
The original one-page Weekly Special PDF is still available.
Get the Weekly Special Every Monday
Each Monday morning the Weekly Special takes one Tallahassee housing question, answers it with a chart of local sales, and explains what it means for your next move.
It is free, and you can unsubscribe any time.