
Weekly Special | September 24, 2017
How Home Appreciation Rates Differ By Zip Code
Homes continue to move up in value across the Tallahassee real estate market, but a 15 year analysis of appreciation rates reveals some interesting facts.
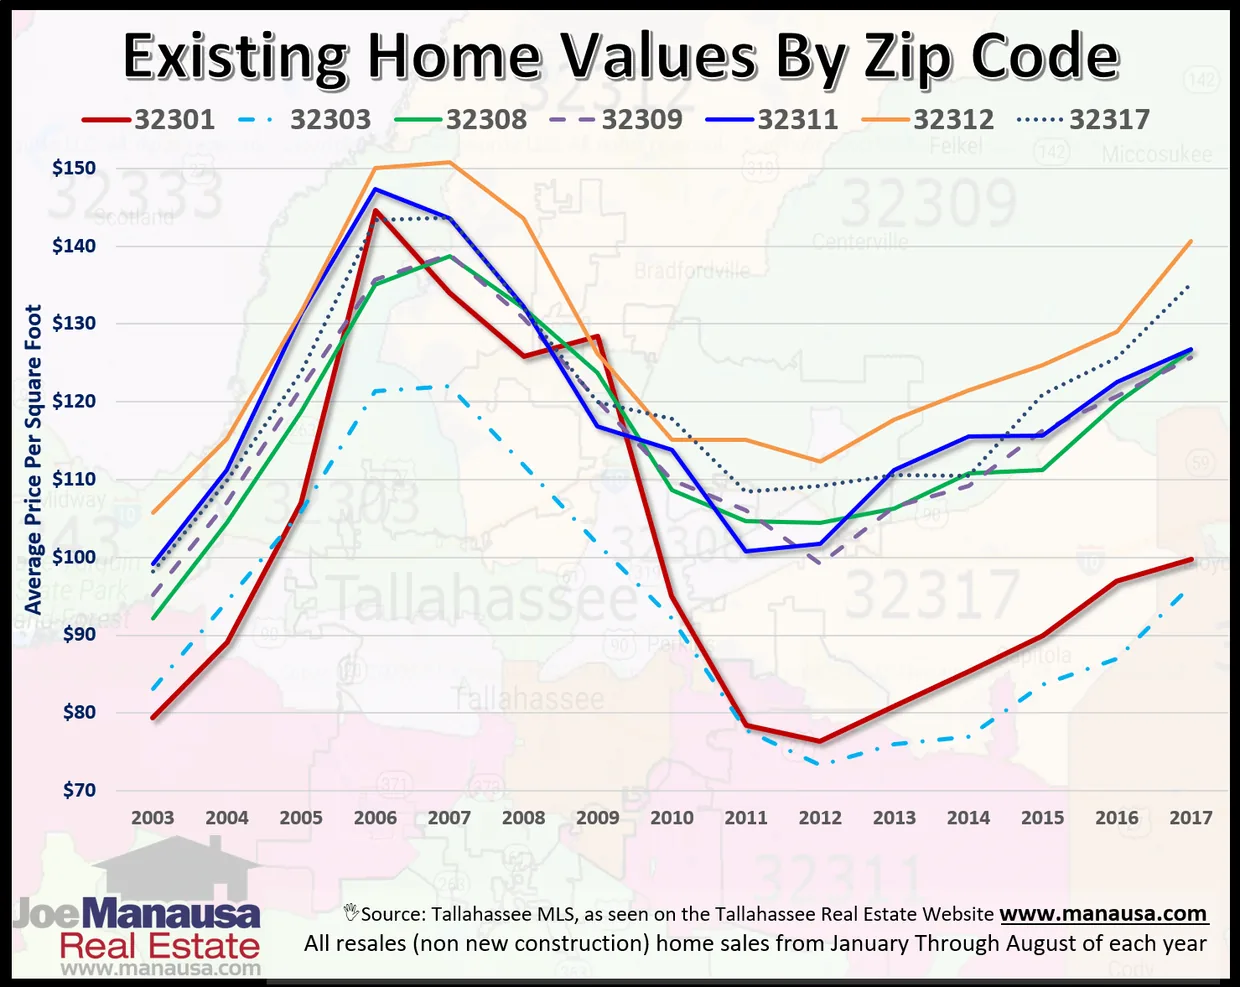
The graph above was created from data extracted from the Tallahassee Board of Realtors Multiple Listing Service from January through August of each year from 2002 through 2017.
We calculated the average value each year (measured in price per square foot of heated and cooled space of each home) and plotted a line graph.
Since the beginning of our data, the biggest movers have been the 32317 and 32308 zip codes (up 37.6% and 37.5% respectively) while the 32303 zip code trailed the pace significantly, up only 15.9% during the entire time span.
But change might just be underway for the 32303 zip code.
The 32303 zip code has shown the greatest rate of appreciation over the past year (up 10.8%) as well as moved the highest since market bottom (up 31.5%).
Some Values Near Record Highs Home values in the 32317 zip code are 6% below the market peak (2007), while home values in the 32312 zip code are 7% below market peak.
The 32301 zip code has the furthest yet to go as values there remain 31% below the peak of the market (2006).
This issue went with a longer report on our blog: read the full blog post. The original one-page Weekly Special PDF is still available.
Get the Weekly Special Every Monday
Each Monday morning the Weekly Special takes one Tallahassee housing question, answers it with a chart of local sales, and explains what it means for your next move.
It is free, and you can unsubscribe any time.