
Weekly Special | September 16, 2017
More Green Than Red For Tallahassee Home Sales
Year over year (YoY) home sales are up over 4% through August of this year when compared to home sales through August last year according to the Tallahassee Board of Realtors Multiple Listing Service.
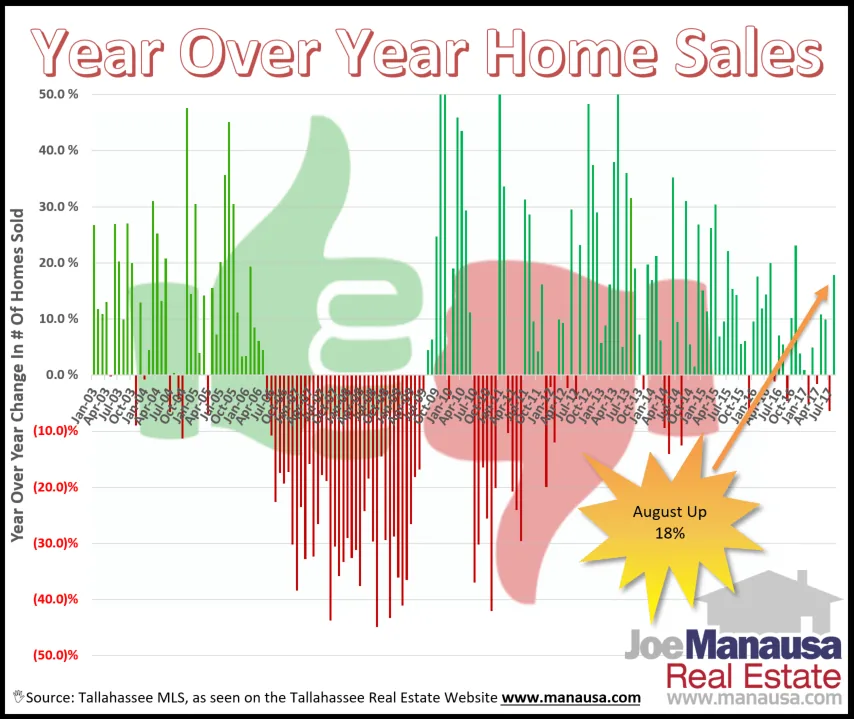
YoY performance is frequently used by real estate experts seeking to gauge whether a market’s sales performance is improving or worsening.
The graph above compares monthly home sales with the corresponding month of the previous year. When the current month reports more sales, it is plotted as a green column above the zero axis. The opposite is true for declining months and is colored red.
Over the past 24 months, only six months have seen a decline in home sales while 18 months have reported gains. This is good for Tallahassee homeowners.
The recovery of the Tallahassee housing market appears to be continuing forward, and the increase in home sales has helped eradicate the glut of homes for sale in many areas and price ranges below $450,000.
So long as mortgage interest rates remain low and the inventory of homes for sale is replenished (at the key price ranges where the majority of buyers are active), we should expect more gains than declines in future YoY reports.
This issue went with a longer report on our blog: read the full blog post. The original one-page Weekly Special PDF is still available.
Get the Weekly Special Every Monday
Each Monday morning the Weekly Special takes one Tallahassee housing question, answers it with a chart of local sales, and explains what it means for your next move.
It is free, and you can unsubscribe any time.