
Weekly Special | June 11, 2017
Best Of Times For Tallahassee Home Sellers
The shortage of homes for sale in Tallahassee has created a seller’s market like we haven’t seen since the peak of the housing market more than 11 years ago.
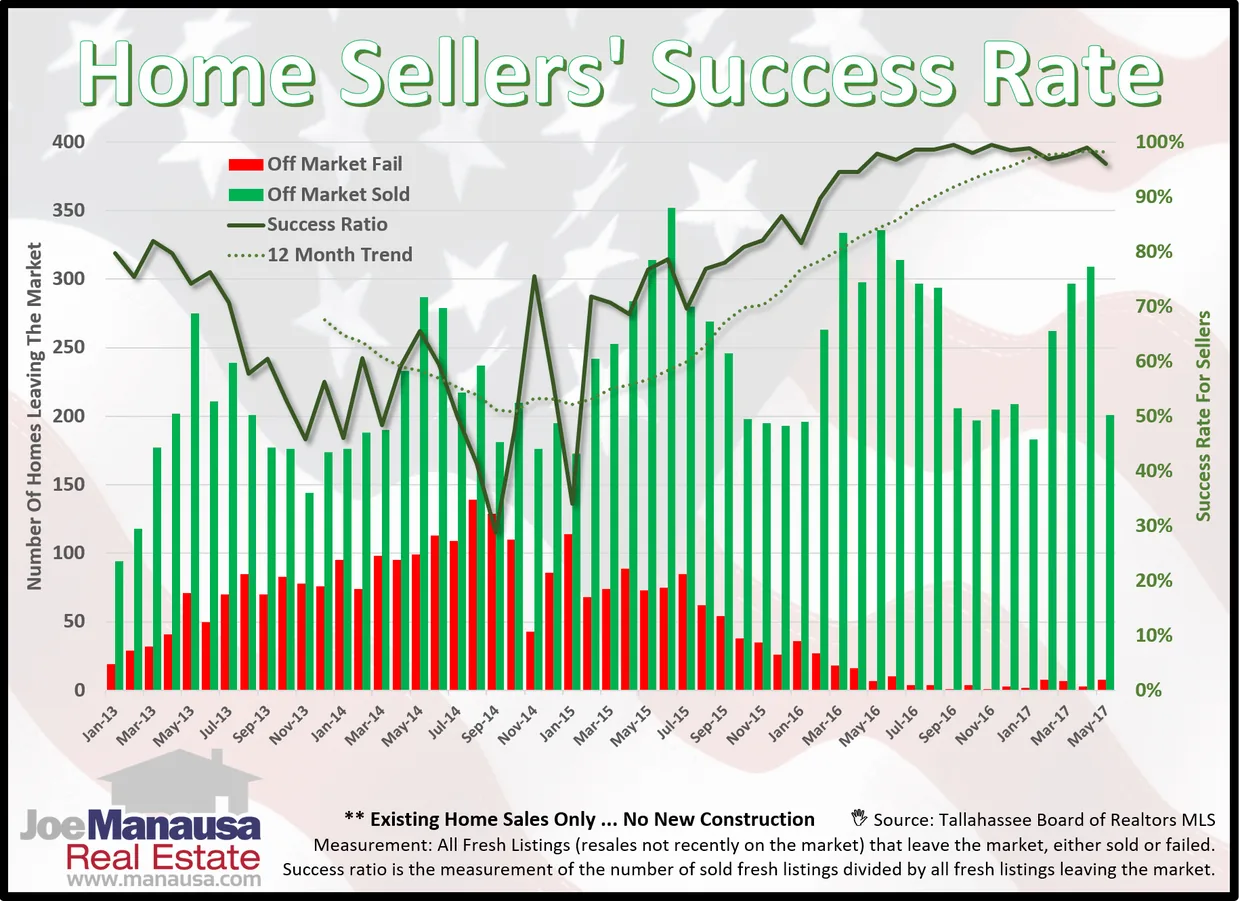
The graph above measures the success rate of fresh sellers (a fresh seller is somebody who lists their home for sale for the first time since was began this measurement back in September of 2012).
Additionally, we have removed all new construction sales so that this information can give existing homeowners and great view of the housing market should they decide to join in the fun.
We have taken all listing information from the Tallahassee MLS and looked at the initial listing date for each seller. Then we compiled (each month) the fresh listings “leaving” the market. They either leave because they succeeded (the home was sold), or homes left the market after having failed to sell. We omit them from this measurement when they re-enter the market as a “stale” listing.
During the month of May, 96% of the listings that left the market went out as sales. In April, it was 98%.
Homes that are properly marketed are selling, and they are selling fast.
Homes that are not properly marketed continue to rotate through the stale listing mix and when they sell, they end up netting less than they would had they sold as a listing fresh to the market.
This issue went with a longer report on our blog: read the full blog post. The original one-page Weekly Special PDF is still available.
Get the Weekly Special Every Monday
Each Monday morning the Weekly Special takes one Tallahassee housing question, answers it with a chart of local sales, and explains what it means for your next move.
It is free, and you can unsubscribe any time.