
Weekly Special | June 4, 2017
Home Sales Rise 6% In May – Will It Continue?
The housing market continues to expand in Tallahassee, as home buyers pick through the limited inventory and wait for new sellers to arrive.
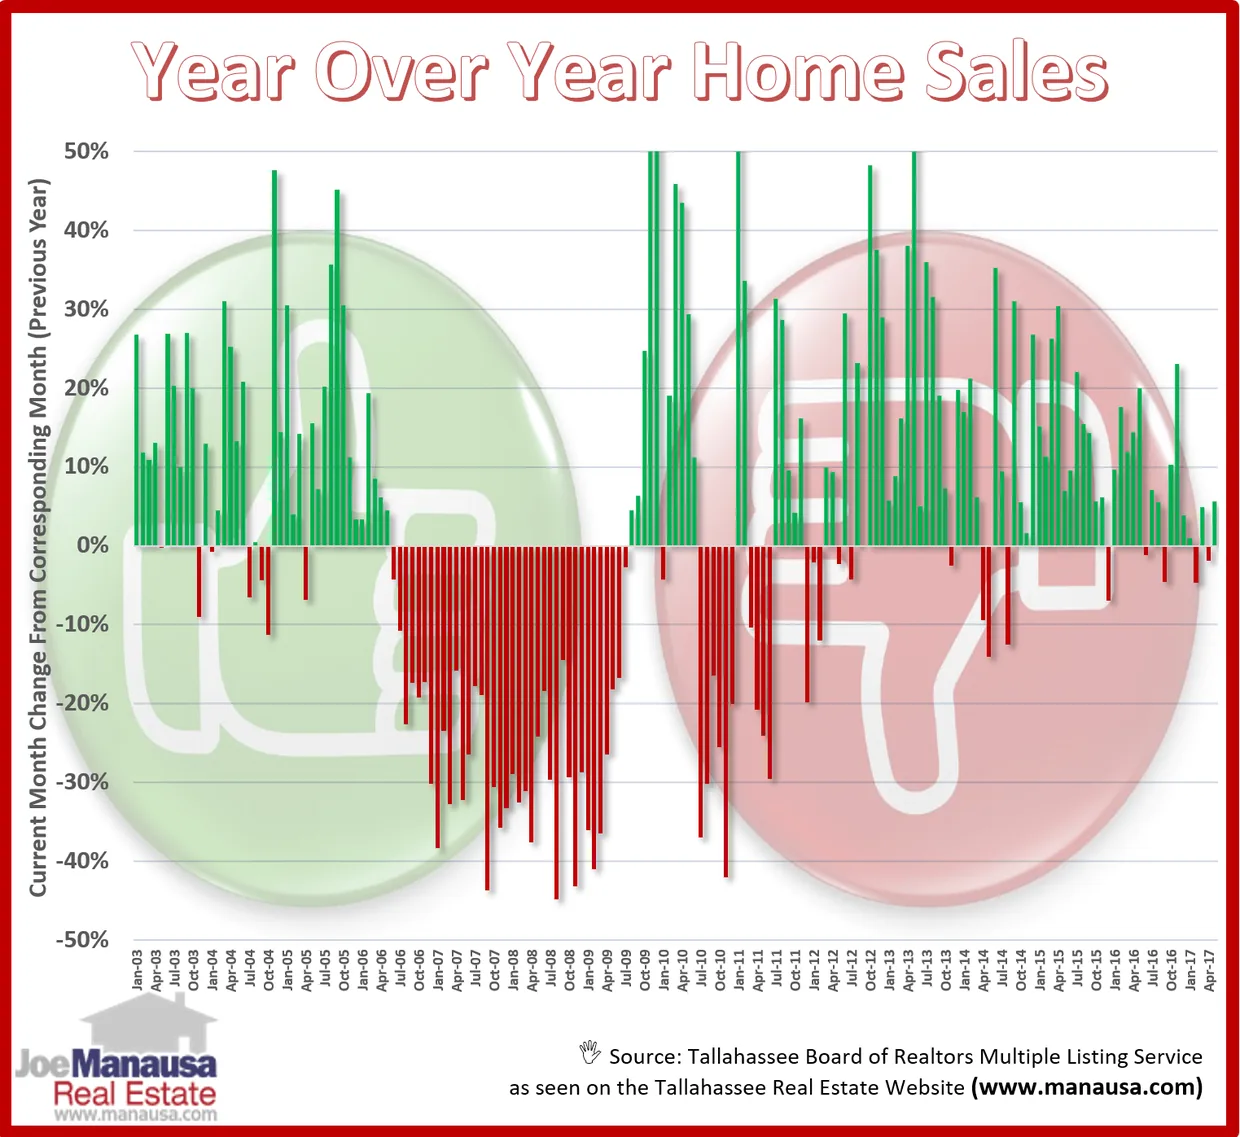
In the graph above, the horizontal axis represents “no change” when comparing a month to it’s corresponding month from the previous year. A green vertical bar measures positive change, while a red vertical bar measures negative change.
Through May, the Tallahassee real estate market is up 1.5% versus home sales through May of 2016. Prior to the strong performance in May, overall market conditions had been flat.
Bullish With One Caveat It’s not mortgage interest rates or demand from buyers that will slow down the recovery of the housing market, instead it is the potential supply of homes.
Other than high end homes and parts of the South Side of town, the inventory of homes for sale is down to the lowest level that I have seen since I began tracking. Currently, there are only 4.8 months of supply overall (a buyers mkt).
This issue went with a longer report on our blog: read the full blog post. The original one-page Weekly Special PDF is still available.
Get the Weekly Special Every Monday
Each Monday morning the Weekly Special takes one Tallahassee housing question, answers it with a chart of local sales, and explains what it means for your next move.
It is free, and you can unsubscribe any time.