
Weekly Special | November 1, 2021
Home Sales By Price Range
Soaring home prices have changed the look for a lot of the graphs that I have maintained over the past thirty years selling homes in Tallahassee. The one above is a great example of the change that we are seeing in the market.
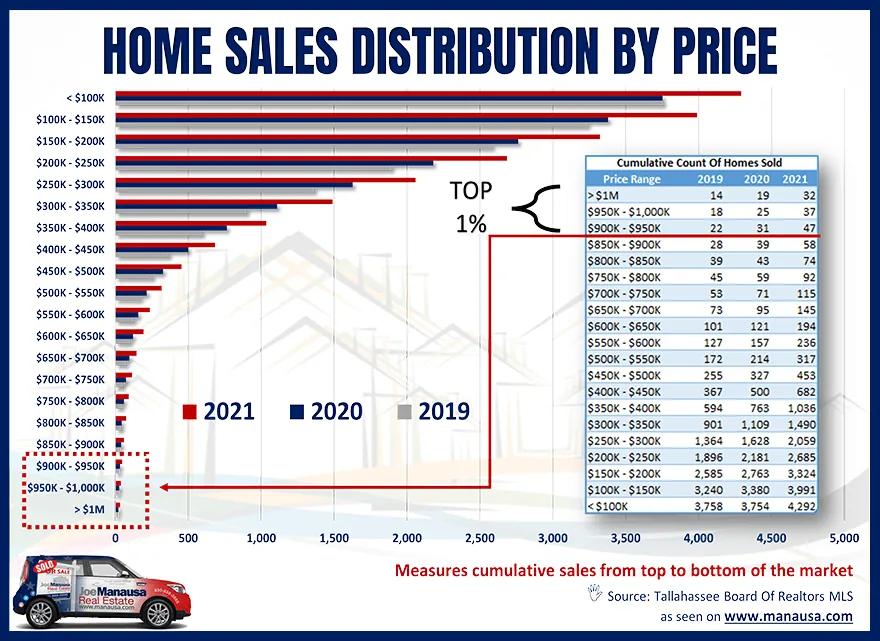
Take a look at how home sales are distributed by price. The graph shows the cumulative count, starting at the bottom of the graph (or top down in the table) and moving to the opposite end.
I really like the image the graph creates as it shows that so many of our sales remain below $200K (52% of all sales), yet we know it’s nearly impossible to find a home at that price or below in most of Tallahassee. Nearly 90% of all homes sold were at prices below $400K, yet we’re seeing bidding wars in most of Tallahassee when a $400K home hits the market. Perhaps the biggest shocker is that we’ve seen 32 homes sell for more than $1M this year, which is more than double the amount sold in all ten years combined in the 1990s!
Ten Years Of Change Here are some interesting statistics for percentage of the market 2021 when compared to 10 years ago:
Homes < $100K: 7% now versus 29% 10 years ago.
Homes < $150K: 23% now versus 49% 10 years ago (nearly 1/2 of all homes sold for less than $150 in 2011).
Homes > $700K: 3% now versus 1% ten years ago.
Like to know more about the current inventory? Just watch the video above.
The original one-page Weekly Special PDF is still available.
Get the Weekly Special Every Monday
Each Monday morning the Weekly Special takes one Tallahassee housing question, answers it with a chart of local sales, and explains what it means for your next move.
It is free, and you can unsubscribe any time.