
Weekly Special | November 8, 2021
Will 2021 Move To #2 ?
Year to date home sales continue a strong trend, now up 16% through the month of October.
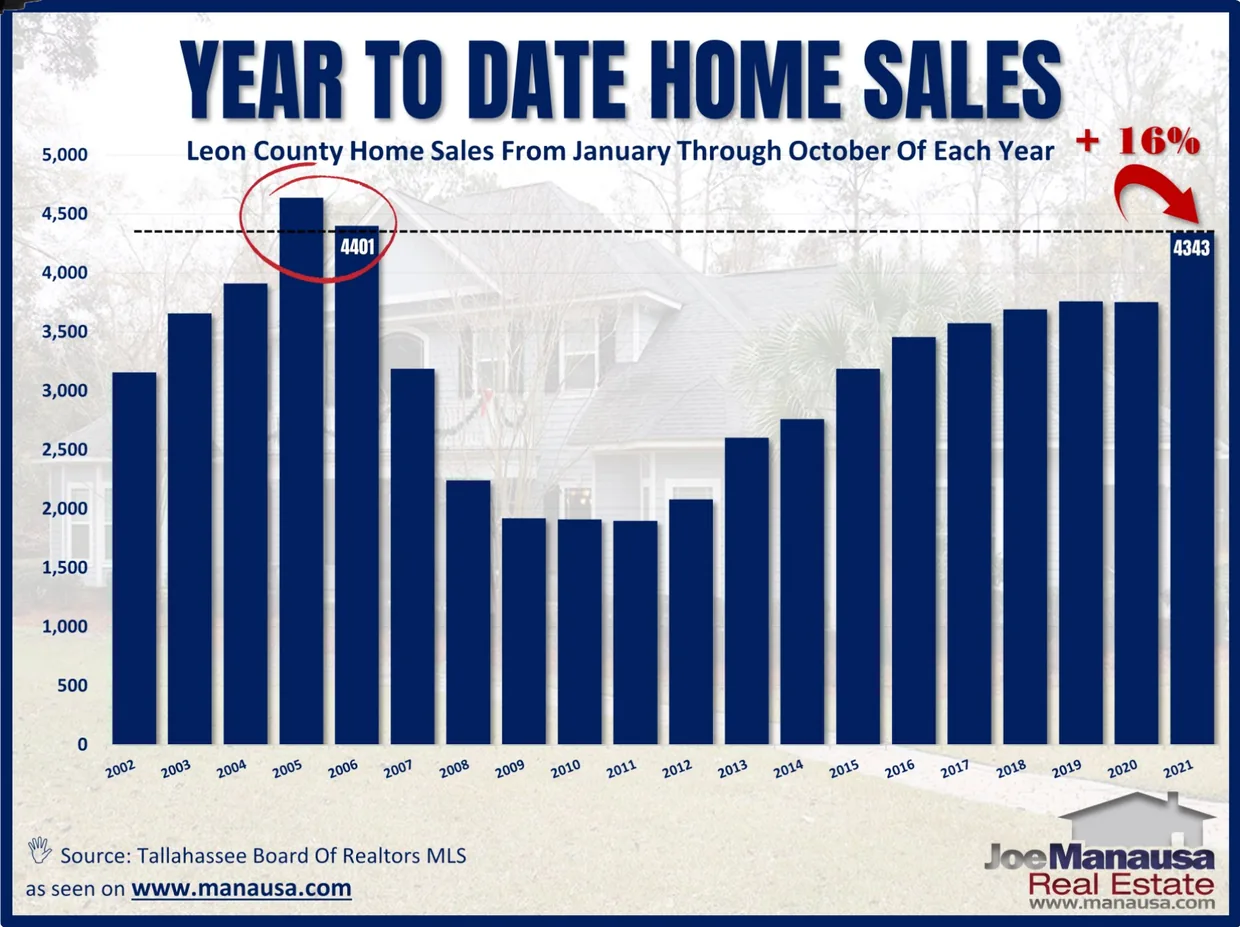
The blue bars in the graph above report the total number of homes sold from January through October of each year, and it’s clear 2021 is going to be among the best. The red circle shows that only 2005 and 2006 had more home sales in the first ten months of the year, but 2021 is creeping ever-close to 2006 for the #2 position.
I expect more home sales to be recorded in the MLS for October, as not all real estate agents get this done in a timely fashion. Nevertheless, the 4,343 homes sold right now is less than 2% behind the 4,401 reported through October in 2006. Considering 2006 saw the housing market start to collapse, it is now likely that 2021 will pass 2006 for the second-best year on record for the number of homes sold in Tallahassee.
The market has the same problems today as it has faced for the past few years. Demand is strong, but the inventory of homes for sale is far too low. Slow production levels by local builders for the past six years has the market positioned favorably for sellers and poorly for buyers.
Closings in the month of October were slightly stronger than October of last year, and every single month of the year has outperformed its counterpart from the year prior. So long as mortgage rates don’t move too high too fast, expect to see 2021 close out the year as #2!
The original one-page Weekly Special PDF is still available.
Get the Weekly Special Every Monday
Each Monday morning the Weekly Special takes one Tallahassee housing question, answers it with a chart of local sales, and explains what it means for your next move.
It is free, and you can unsubscribe any time.