

Weekly Special | April 5, 2021
Home Sales Decline As Population Grows
Today’s report looks at thirty years’ of home sales and compares it with population growth.
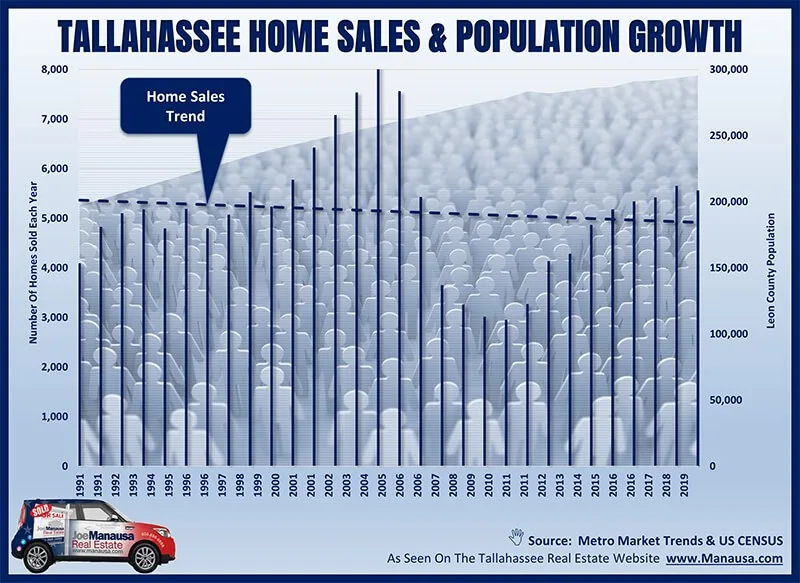
Tallahassee’s annual population has grown at an average rate of 1.38% from 1991 through the present time, which means there are an additional 50% more people in Tallahassee today than there were in 1991.
One would think that there would be a parallel increase in the overall housing market, but that has obviously not occurred. In fact, the linear trend of home sales is declining.
To be clear, our population is growing, and yet the number of homes selling each year is on the decline!
One explanation could be that the 1990s enjoyed a robust housing market, and if our data went back further, we might see significantly lower sales figures in the 1980s and 1970s. Unfortunately, I do not have that data.
Our growing population might be accounted for in the growth of multi-family properties (of which student growth could very well be accounted for there), but I believe this graph reveals a reason to be bullish on home sales for the coming years.
Remember, there are 50% more Tallahasseans today than there were in 1991, and they all have to live somewhere. If not in single-family homes, then mobile homes and multi-family housing must make up the difference. We’ll explore those property types in a future report, but you can see more about home sales trends HERE.
This issue went with a longer report on our blog: read the full blog post. The original one-page Weekly Special PDF is still available.
Get the Weekly Special Every Monday
Each Monday morning the Weekly Special takes one Tallahassee housing question, answers it with a chart of local sales, and explains what it means for your next move.
It is free, and you can unsubscribe any time.