
Weekly Special | August 5, 2024
Unlocking Tallahassee’s Housing Price Trends
They say a picture is worth a thousand words, and today’s newsletter shares a doozy for how much home prices have changed since I got my real estate license in 1991.
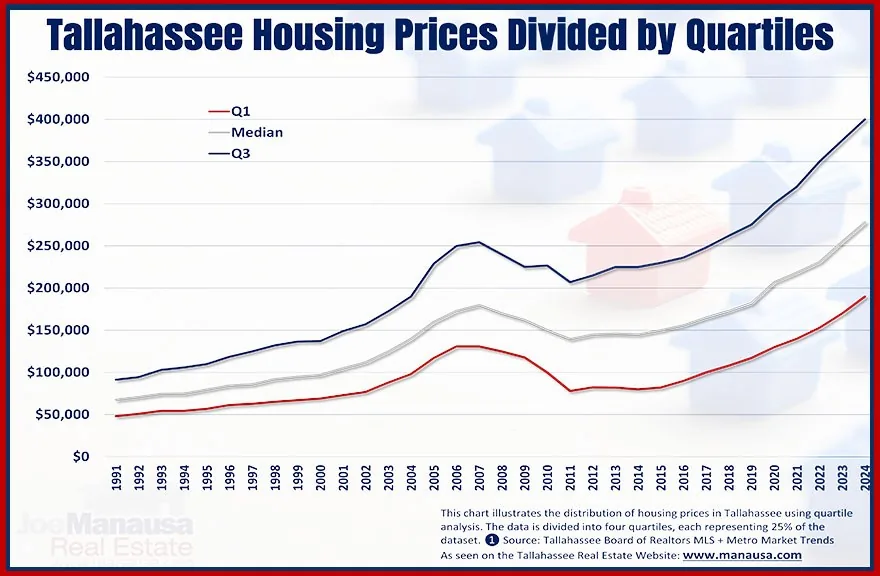
This graph illustrates the distribution of housing prices in Tallahassee using quartile analysis. The data is divided into four quartiles, each representing 25% of the dataset.
Q1 (First Quartile): Represents the price below which 25% of the housing prices fall.
Q2 (Second Quartile/Median): The median housing price, below which 50% of the housing prices fall.
Q3 (Third Quartile): Represents the price below which 75% of the housing prices fall.
Q4 (Fourth Quartile): Represents the highest 25% of housing prices.
The quartiles help to understand the spread and central tendency of housing prices in Tallahassee. For example, in 1991, three quartiles were below $100K, meaning only the top 25% of homes sold for more than $91,500.
Today, 50% of all homes sold fall between $190,000 and $400,000. It’s hard to fathom how a $185,000 home can fall in the lowest quartile.
Even with the large correction from 2007 through 2012, home price have exploded higher. How much more do you pay for a home in 2024 compared with 1991?
1st Quartile: 296% more 2nd Quartile: 312% more 3rd Quartile: 337% more
The original one-page Weekly Special PDF is still available.
Get the Weekly Special Every Monday
Each Monday morning the Weekly Special takes one Tallahassee housing question, answers it with a chart of local sales, and explains what it means for your next move.
It is free, and you can unsubscribe any time.