
Weekly Special | August 12, 2024
Home Affordability Through The Years
How affordable are homes today compared to the past 53 years? That’s the question I explored before creating this report.
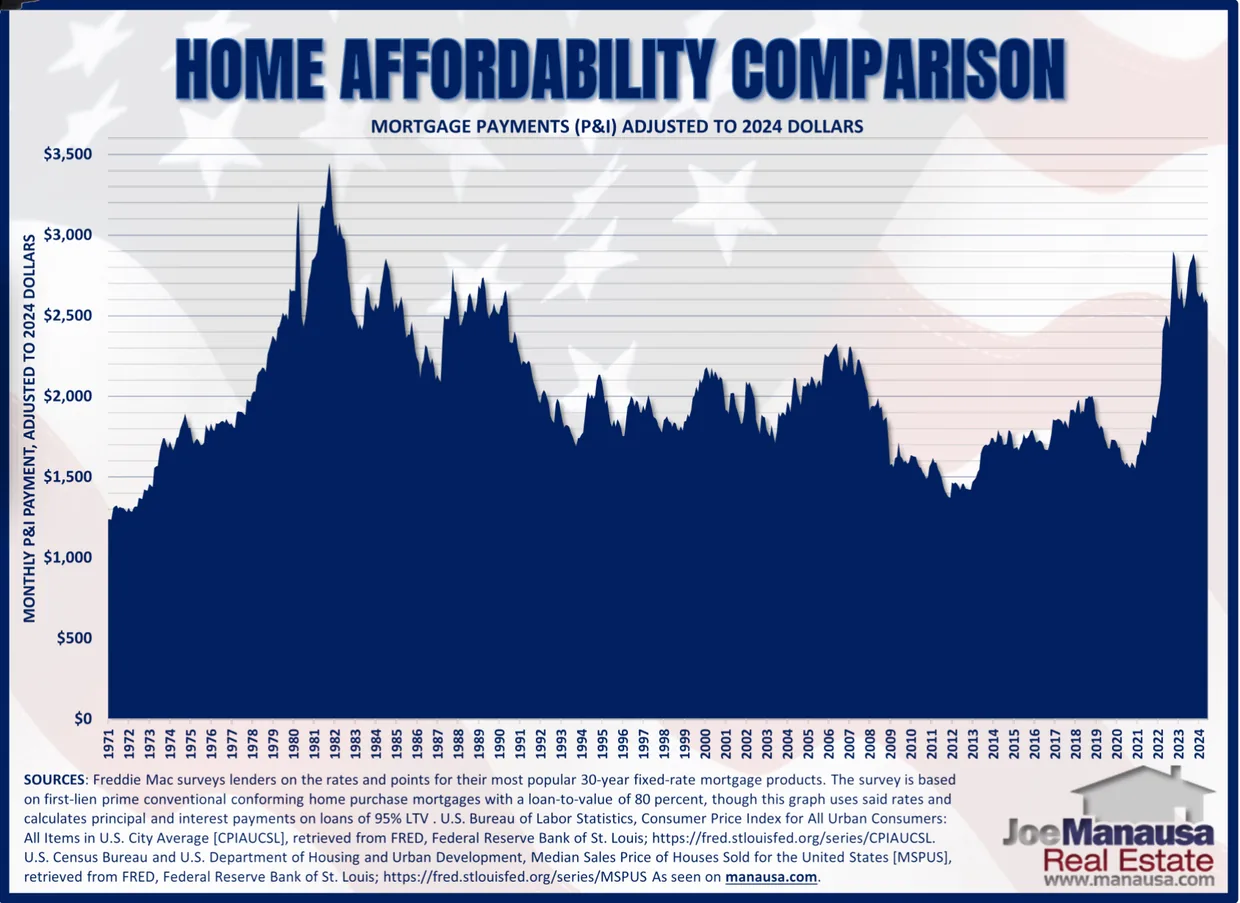
Although the graph may appear simple, compiling it required extensive data. By leveraging historical data on mortgage interest rates, median home prices, and the consumer price index (inflation), I calculated the monthly mortgage payments (Principal & Interest) for each month, adjusted to 2024 dollars.
This adjustment ensures that the payments on the far right in 2024 reflect current values, while the payments to the left of 2024 have been adjusted, allowing us to compare home affordability levels over time.
While today’s median home mortgage payment is nearly double what buyers faced in 2020, we have not established a new all-time high as 1981’s record is still far above today.
Though no new record has been reached (thankfully), home affordability today is worse than at any time since the 1980s. Buyers today are facing tough times, and it’s got a lot of people expecting home prices to come down. Unfortunately, that is not likely.
Unlike 2008 when new construction was pumping out new homes at above-normal rates when the government took away loan programs for their buyers, today we’re coming off of 15+ years of under-building for our growing population. Supply is so low it is not likely we’ll see major home value declines, even as demand falls.
The original one-page Weekly Special PDF is still available.
Get the Weekly Special Every Monday
Each Monday morning the Weekly Special takes one Tallahassee housing question, answers it with a chart of local sales, and explains what it means for your next move.
It is free, and you can unsubscribe any time.