
Weekly Special | October 1, 2018
How Much Is Your Home Worth Today?
I had to dig deep to find an image of the Tallahassee real estate market that we have not used in many years.
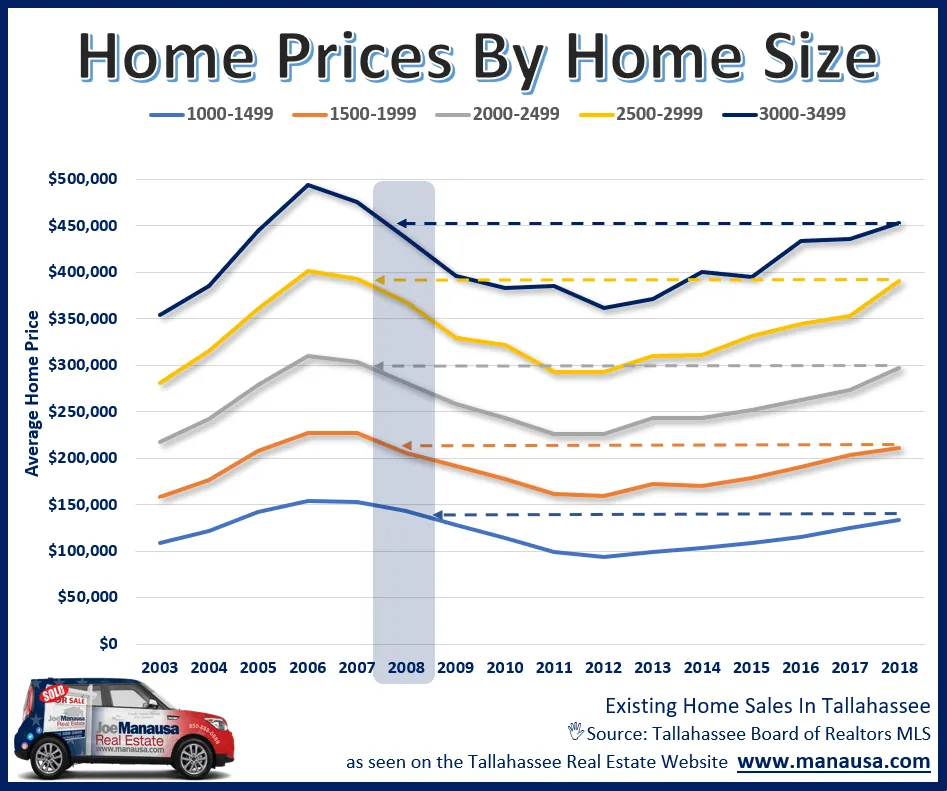
Before we had access to powerful spreadsheets and database programs, we would simply record average home prices each year, sort them by home size, and we could roughly determine appreciation by measuring the changes that occurred over time.
The graph above does this very thing. All homes sold and recorded in the Tallahassee MLS since 2003 were sorted by size (measured in heated and cooled square feet) and grouped in 500 square foot bunches starting with homes that were at least 1,000 square feet and only up to 3,500 square feet.
Home prices today appear to be the same as prices from late 2007 to early 2008 (blue shaded area above).
How To Use This Graph Let’s say that you purchased 2,700 square foot home in 2004 and you paid $280K. Look at the gold colored line in the graph and you’ll see that your price was below the market by roughly 13%.
If you have maintained the home in roughly the same condition and the same level of updates versus the current market, it should sell for roughly 13% below the current market, meaning a price of $347K.
The original one-page Weekly Special PDF is still available.
Get the Weekly Special Every Monday
Each Monday morning the Weekly Special takes one Tallahassee housing question, answers it with a chart of local sales, and explains what it means for your next move.
It is free, and you can unsubscribe any time.