
Weekly Special | October 3, 2018
3rd Quarter Home Sales Same As 2017
Home sales in the third quarter were the same in 2018 as they were in the third quarter of 2017, a continuing sign that the housing market recovery is cooling off.
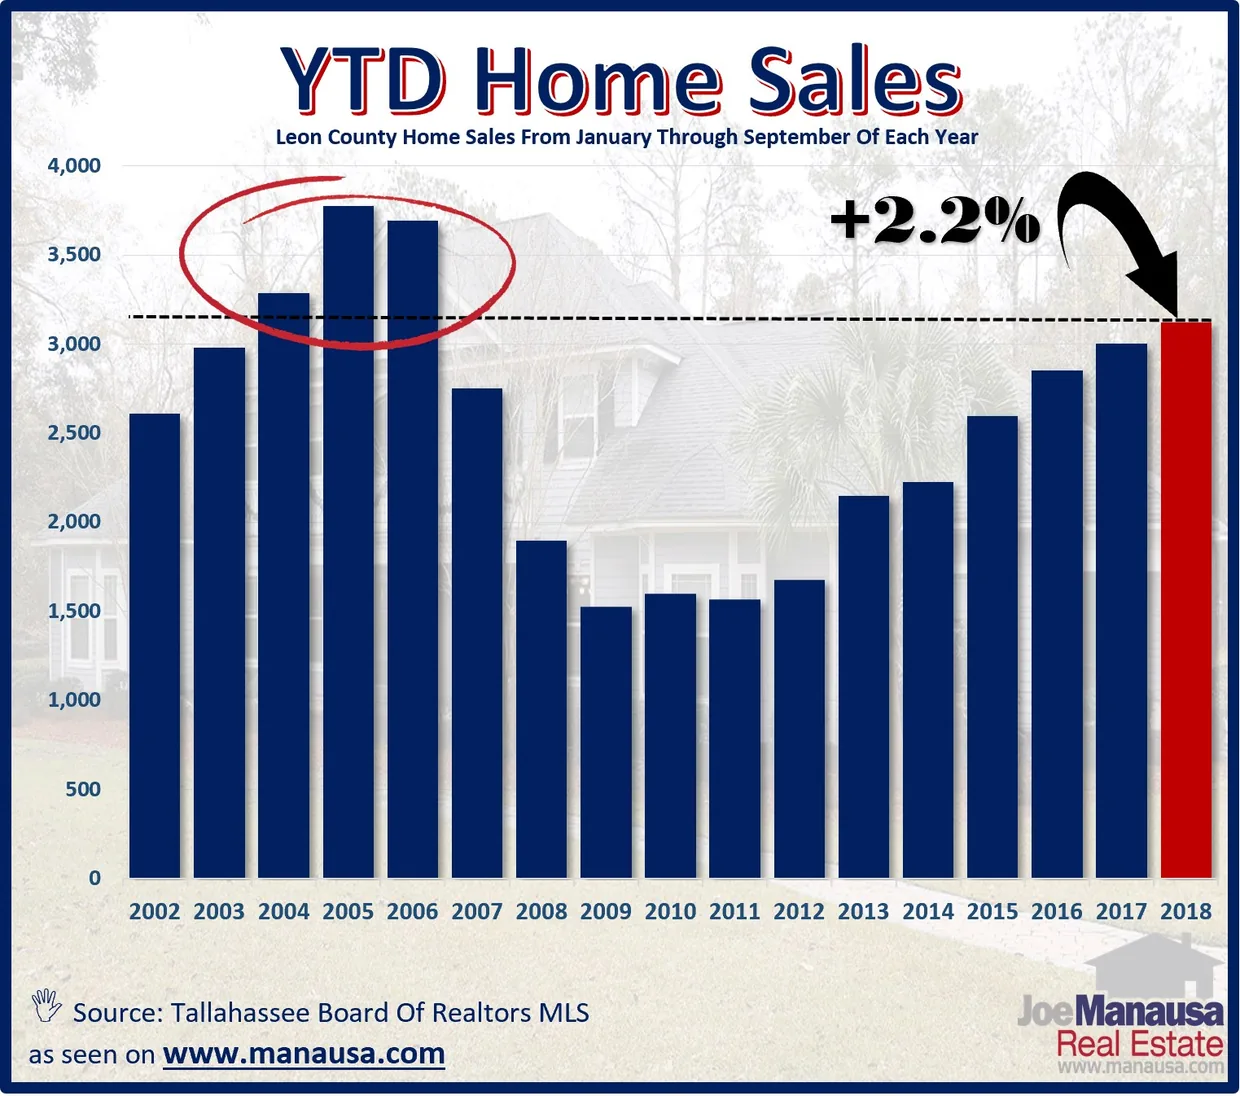
Nevertheless, year-to-date home sales are at a twelve year high, having only been bettered by the years circled in the graph above (2004, 2005, and 2006).
Overall, the market is up about 2.5% over this time last year (we expect to see more home sales posted for September by real estate agents who are late to report), but not so much as to greatly impact today’s message.
How Many Home Sales Is Normal?
The biggest question from this report is whether or not we see a cooling market as “negative” or “positive,” and I suggest that it is neither.
I think we are approaching the “right” amount of home sales for Tallahassee’s population size (if you are worried about a housing bubble, you should read this).
We know that our population has grown, thus the number of home sales should grow too. But we also know that the market was grossly inflated by investors from 2003 through 2006, so today appears about right.
The original one-page Weekly Special PDF is still available.
Get the Weekly Special Every Monday
Each Monday morning the Weekly Special takes one Tallahassee housing question, answers it with a chart of local sales, and explains what it means for your next move.
It is free, and you can unsubscribe any time.