
Weekly Special | November 9, 2015
East Side Leads Recovery In Tallahassee
The housing market recovery is occurring at different rates depending upon where you are located in the Tallahassee real estate market.
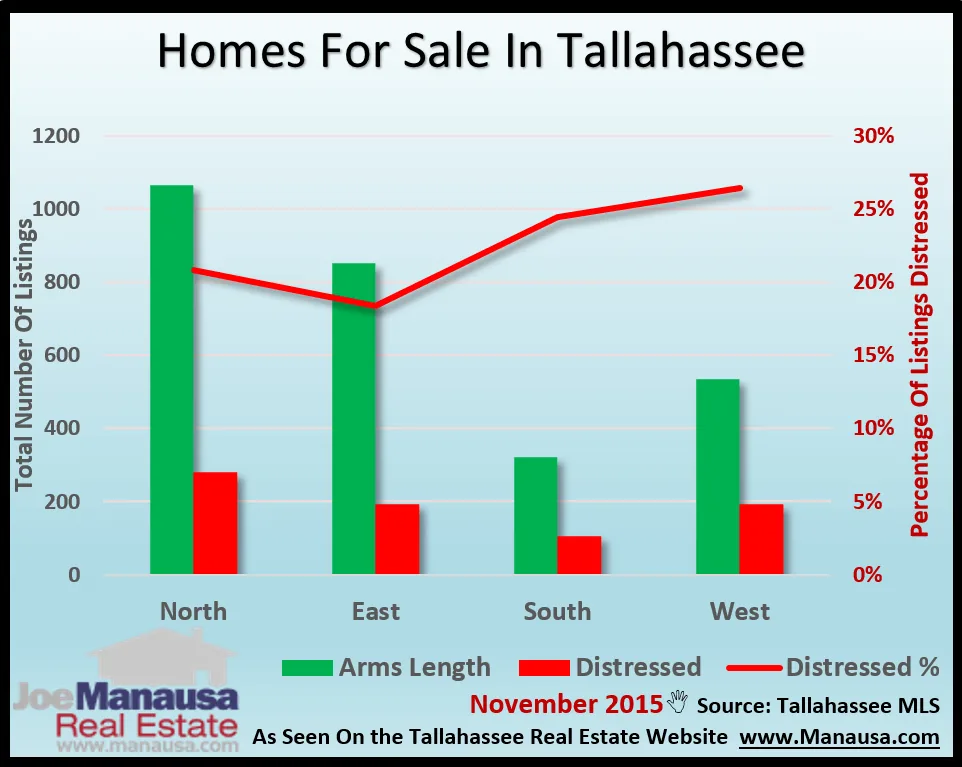
The North side is healthier than the South side The East side is healthier than the West side Northeast Tallahassee is the strongest quadrant while Southwest Tallahassee is the weakest The graph above shows the total number of “healthy” listings in green, while the distressed listings are shown in red.
The number of distressed homes as a percentage of the overall market is shown as a red line and measured on the right vertical axis.
The East side of town has 18% of its listings being marketed as distressed properties, whereas the West side shows 27% of its listings as distressed.
For people living in areas where there are more distressed properties, expect a longer period of time before home values in your area will rise.
The abundant availability of distressed properties is forcing lenders to either hold properties or let them go at lower values, and each of these actions puts pressure on values for owners who are not distressed.
The original one-page Weekly Special PDF is still available.
Get the Weekly Special Every Monday
Each Monday morning the Weekly Special takes one Tallahassee housing question, answers it with a chart of local sales, and explains what it means for your next move.
It is free, and you can unsubscribe any time.