
Weekly Special | September 9, 2024
Demand Down 35% From 2021
If you been reading this newsletter for quite some time, you know that I’ve been reporting sellers’ market conditions for more than five years, but are new conditions emerging?
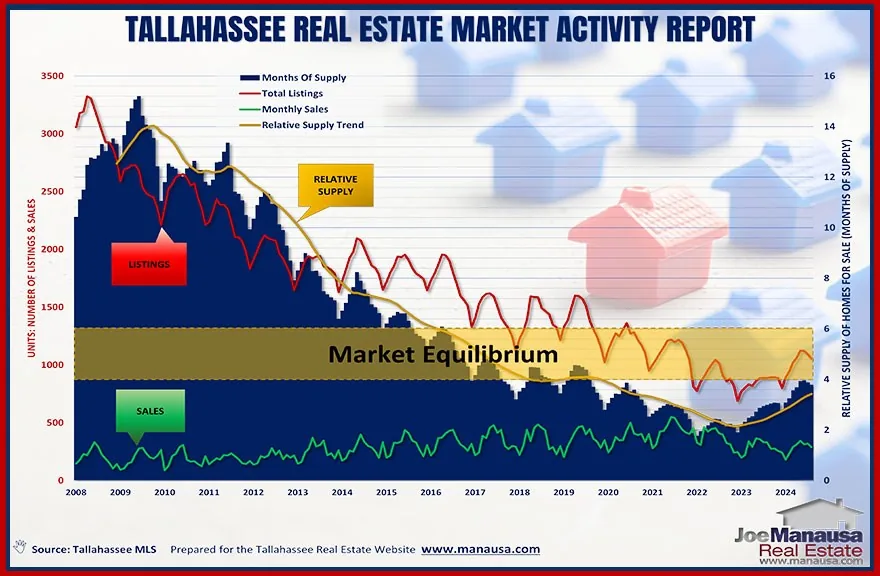
Today’s graph explores the supply and demand dynamic for homes in Tallahassee, expressed in months of supply.
This metric simply measures the current inventory in relation to the current rate of demand, indicating how many months’ worth of homes are available before the market runs out, assuming no new listings are added.
Historically, real estate analysts have defined a balanced market as one with 6 months of supply home homes, but as I have written here, I believe modern analysts should be moving equilibrium closer to four months of supply.
Looking at the gold line in the graph above, the relative supply of homes has dropped dramatically from a hefty 14 months in 2009 to a meager 2.1 months in 2022, and has now climbed back to 3.8 months of supply today.
By anybody’s standard, we’re still in a sellers’ market, but we are very close to equilibrium. So does that mean the market is now or soon will be healthy?
Demand Has Slowed Due to several factors like low demand and the lock-in effect from recently-higher mortgage rates, demand has cooled by 35% when compared to the same time in 2021. Demand remains 46% higher than what we recorded in 2011, and I’m concerned that anything that fires up demand (lower rates, new loan programs) will cause prices to soar (again) unless we build more homes.
This issue went with a longer report on our blog: read the full blog post. The original one-page Weekly Special PDF is still available.
Get the Weekly Special Every Monday
Each Monday morning the Weekly Special takes one Tallahassee housing question, answers it with a chart of local sales, and explains what it means for your next move.
It is free, and you can unsubscribe any time.