
Weekly Special | June 28, 2021
Local Construction Slower Than US Average
With the supply of homes so low in Tallahassee (and across most other US housing markets), I decided I would try to figure out how Tallahassee compares with the US average for new home construction activity.
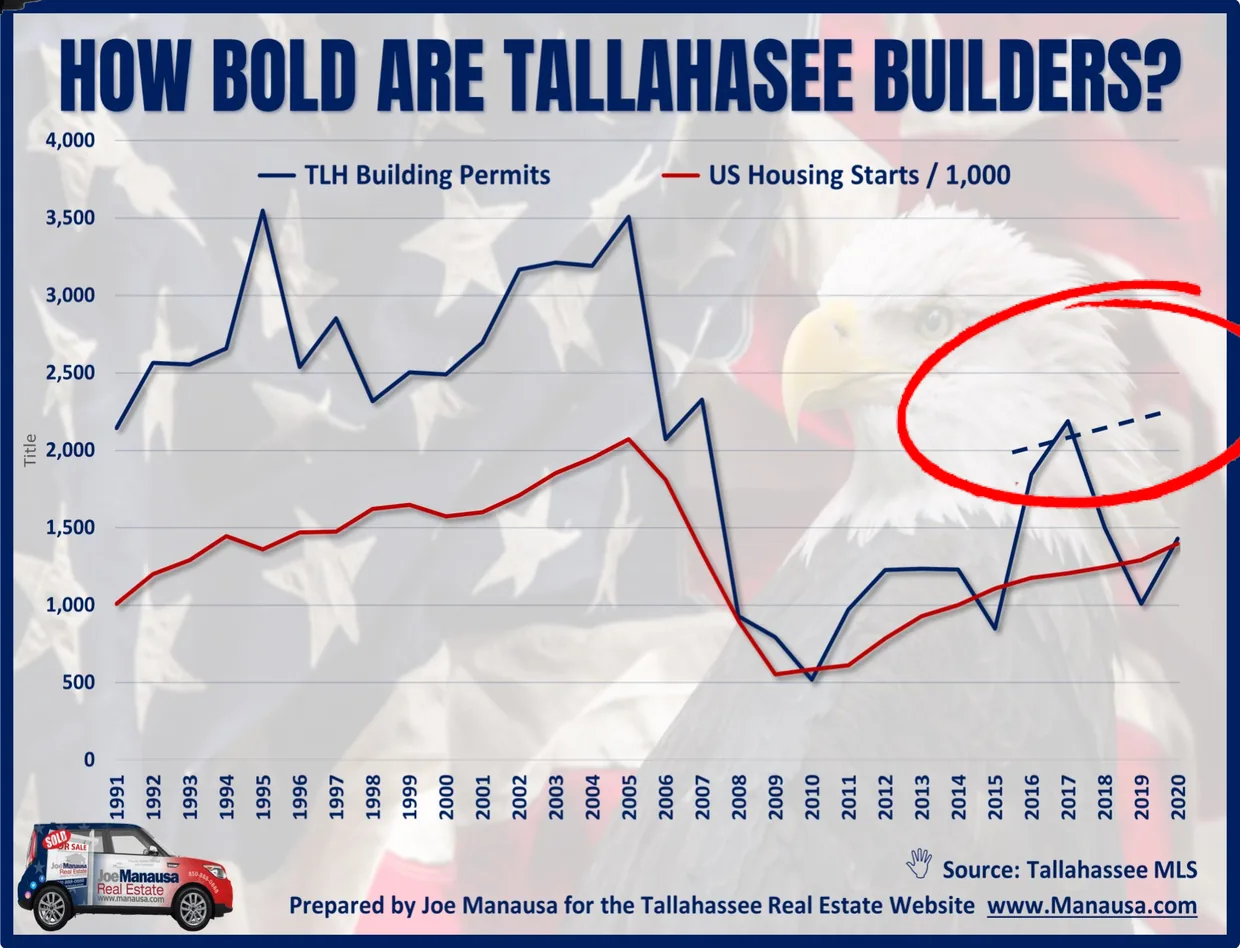
The best comparison that I could come up with was to plot housing starts in the US against building permits in Tallahassee. The comparison is not perfect, but housing starts and permits are similar enough to give us a feel for how we might compare.
The blue line in the graph above plots the number of single-family building permits in Tallahassee each year, while the red line plots new privately-owned housing units started in the US each year.
Both the US housing market and the Tallahassee market started plummeting at the same time, but Tallahassee spiked up higher prior to the crash and then fell much further than did the overall US average.
If you look at the dashed blue line that I have circled on the graph, you’ll see where Tallahassee would need to be in permits to reach the US average. But here’s the kicker … The US housing market is undersupplied right now and is several million homes short of what it needs to reach market equilibrium. This means that US homebuilders are not producing enough homes, and Tallahassee is bringing them to the market slower than average.
The original one-page Weekly Special PDF is still available.
Get the Weekly Special Every Monday
Each Monday morning the Weekly Special takes one Tallahassee housing question, answers it with a chart of local sales, and explains what it means for your next move.
It is free, and you can unsubscribe any time.