
Weekly Special | January 8, 2024
Appreciation Rate Still Too High
If there was one theme that was most prominent among real estate reports for the past five years, it was that “we need more homes!”
Tallahassee, like most of the US, has too few places for people to live. This scarcity has caused both home prices and rents to rise at unhealthy rates.
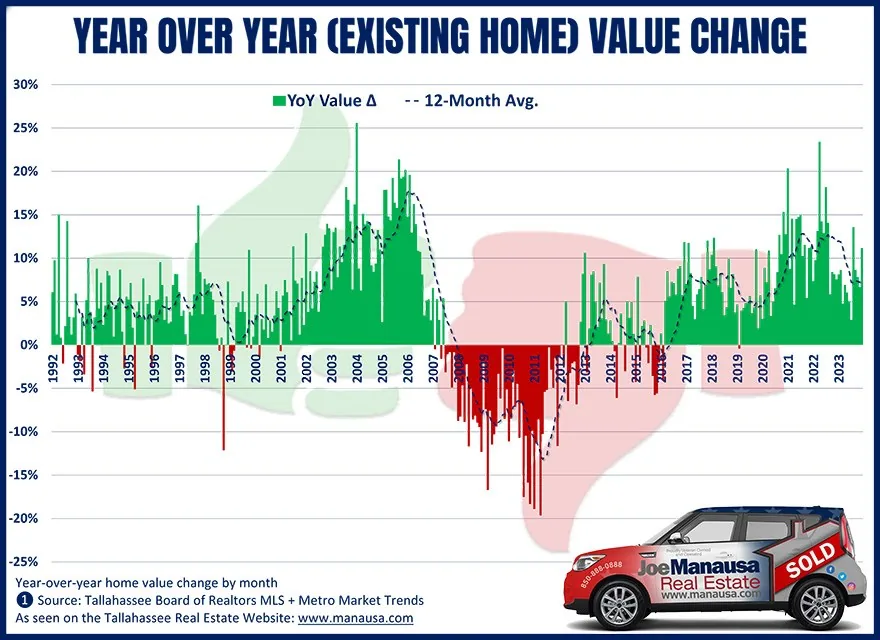
The graph above plots year-over-year existing home value changes in Tallahassee (measuring the average price per square foot of resale homes each month and comparing with the same month from the year prior). Green bars show gains, red bars reveal declines, and the dashed-line reports the 12-month average.
The graph starts with data from 1991 (the year I began selling homes in Tallahassee) and continues for 32 years, ending last month in December 2023.
For the past six years, the average annual appreciation rate is just above 10%, a 71% rate of growth since January 2017.
Real estate values are like other commodity values, they move based upon the dynamic between supply and demand. Our population is growing and we’ve been building homes far slower than historical normal rates, so the supply has continued to be below demand.
It doesn’t help that our politicians only embrace demand side solutions (changing the cost and availability of money) when they should be zealously pursuing solutions to the supply side.
The original one-page Weekly Special PDF is still available.
Get the Weekly Special Every Monday
Each Monday morning the Weekly Special takes one Tallahassee housing question, answers it with a chart of local sales, and explains what it means for your next move.
It is free, and you can unsubscribe any time.