
Weekly Special | December 18, 2023
The Cost Of The Housing Crisis
One great way to get a clear understanding of the current housing crisis is to segment the market to evaluate the specific impact on certain buyers. In today’s report, we take a look at how existing four-bedroom homes have changed since the onset of the pandemic.
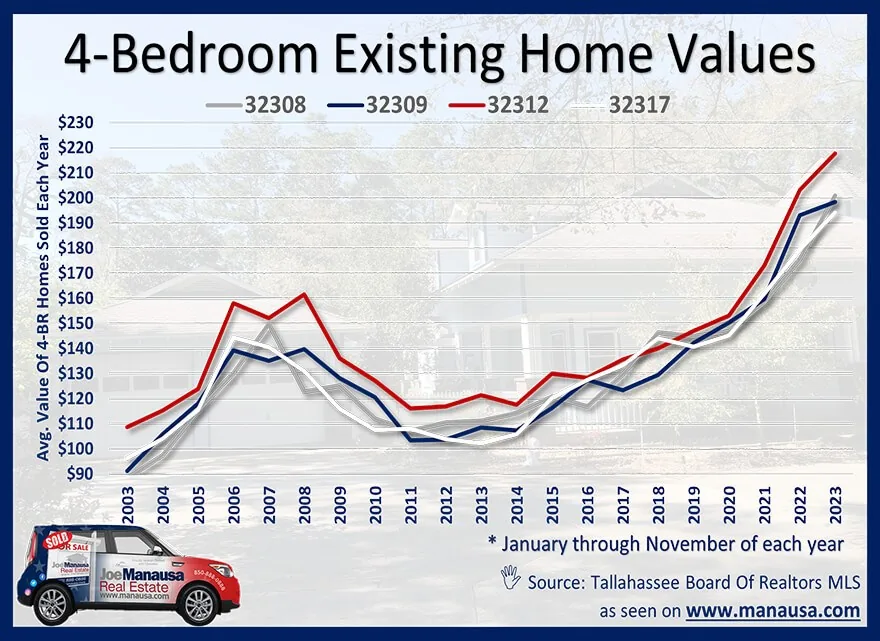
Four popular zip codes in Tallahassee have been isolated and further segmented to only include the sales of existing four-bedroom homes. When we compare today’s values with those from the beginning of 2020, we find the following annual appreciation:
32308: +8.9% 32309: +8.6% 32312: +9.6% 32317: +8.4% Let’s consider the situation of a buyer who was looking for a four-bedroom home at the onset of the pandemic. Perhaps the buyer got spooked and decided to “wait it out.” And perhaps, that buyer is in the market ready to move today, what will the buyer find?
Prior to the pandemic, the buyer had a budget of $400K for a 4-bedroom home that would result in a payment (P&I) of just over $1,700 monthly. Today, that payment would only borrow $256K, and yet the same home he could have purchased in 2020 is now $562K.
Unless the buyer has found an additional $306K over the past four years, the new home is going to be significantly smaller and not as desirable as the home the buyer could have purchased in 2020.
The original one-page Weekly Special PDF is still available.
Get the Weekly Special Every Monday
Each Monday morning the Weekly Special takes one Tallahassee housing question, answers it with a chart of local sales, and explains what it means for your next move.
It is free, and you can unsubscribe any time.