
Weekly Special | January 16, 2023
Why Aren’t Home Values Crashing?
The best way to assess appreciation in the housing market is to evaluate the change in the median existing home value (price per square foot of the median existing home over time).
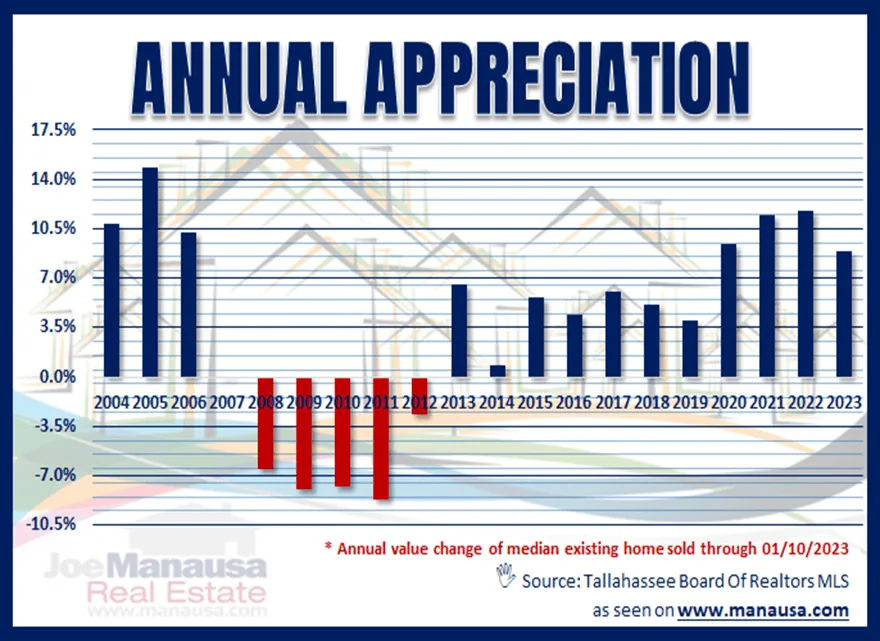
This graph plots the median existing home value each year and reveals the impact that the diminished inventory of homes for sale is having on the change in home values.
The market has been undersupplied since the end of 2016, so home values continue to move higher at an alarming rate.
For each of the past two years, I forecast double digit appreciation, and regrettably, the market met my expectations with 11.4% and 11.7% growth. The demand for homes has dropped sharply since mortgage interest rates doubled in the second quarter last year, but demand is still stronger than the measly supply of homes can serve.
The blue bars in the graph above show that our local appreciation rate remains far above normal, as this year’s rate of 8.9% through just ten days is a warning that we need more homes (fast). Though ten days does not produce a large enough sample size to be considered reliable, we still must consider the current results a sign that things are not getting better.
The number of new homes being built is far lower today than what the market has consumed so the supply of homes is trailing demand. The lack of inventory continues to increase the pressure that is pushing home values higher.
The original one-page Weekly Special PDF is still available.
Get the Weekly Special Every Monday
Each Monday morning the Weekly Special takes one Tallahassee housing question, answers it with a chart of local sales, and explains what it means for your next move.
It is free, and you can unsubscribe any time.