
Weekly Special | January 23, 2023
Home Affordability Chasm Widens
While the whole Twitterverse (and much of YouTube) awaits home prices to crash 50% or so, well-informed real estate investors are playing the long-game.
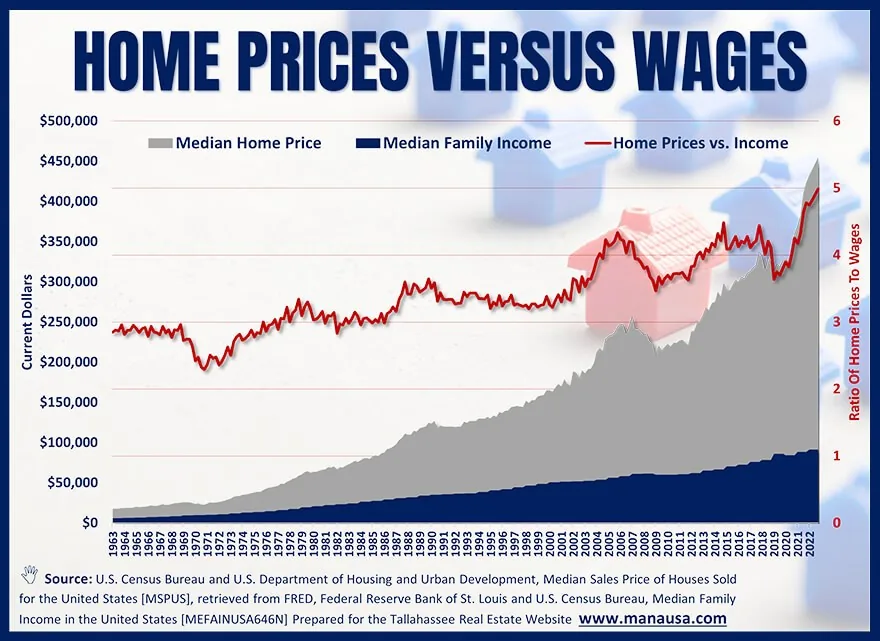
Of all the charts and graphs that I produce and share, this one is as telling as any. It shows that there is a long-term trend on home values that no amount of ignorant reporting is going to turn. And what trend is that?
Check out the red line in the graph above.
It measures the relationship between the median home price and the median family income in the US. It shows that over the past 50+ years, the median family has endured an accelerating cost of living compared to a slower accelerating wage growth. In short, the cost of owning a home has grown faster than the wages needed to buy said home.
From the mid-1960s through the mid-1980s, the median home sold for about three times the median family income. In the 1980s, it rose to an average 3.5, then to above 4.0. Today, we’ve seen the median home price shoot to five times the median family income.
This graph makes it crystal clear that the cost of homes is rising faster than most people can afford, and over a period of 50+ years, that happens for just one reason. Scarcity.
There are not enough homes I the US to house our growing population, so expect this trend to continue until we see changes in how we manage growth.
The original one-page Weekly Special PDF is still available.
Get the Weekly Special Every Monday
Each Monday morning the Weekly Special takes one Tallahassee housing question, answers it with a chart of local sales, and explains what it means for your next move.
It is free, and you can unsubscribe any time.