
Weekly Special | July 26, 2021
How Does 2021 Stack Up?
Today’s graph ranks each home price segment from 1 to 19 based upon how well 2021 has performed (with a rank of “1” if 2021 had the most home sales down to “19” if 2021 had the fewest number of homes sold of all 19 years).
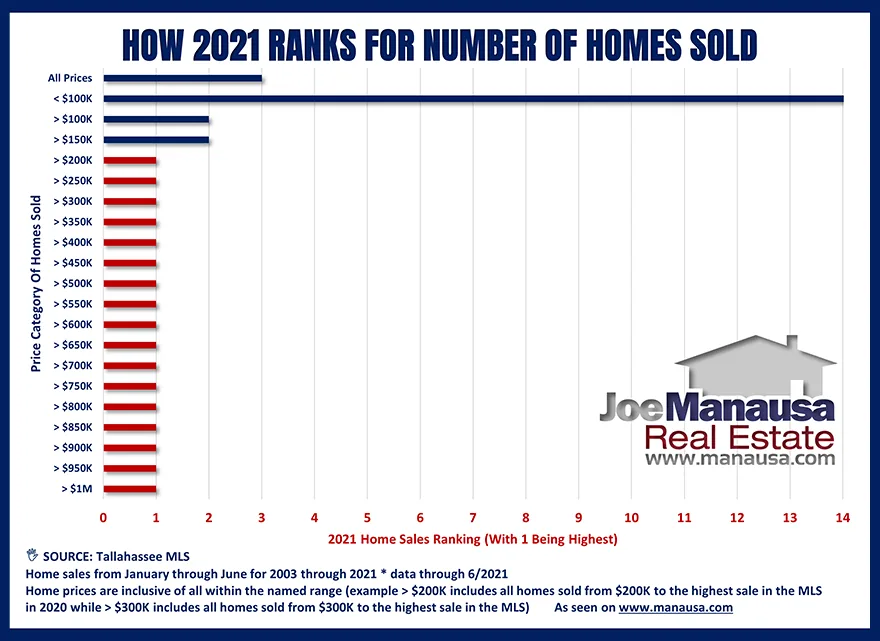
It’s important to understand that each price segment includes all home sales from that price and higher, all the way to the most expensive home sale in 2021. So the easiest way to read this graph is from the bottom up.
2021 has continued the hot run on all homes, including the very top of the market. Here we see that 2021 is ranked #1 for all homes priced over $200K (that’s more than 60% of all homes sold).
This year’s rank drops to “2nd-best year ever” when we look at all homes sold for $100K or more.
Homes priced below $100,000 would be ranked #1 too if there were more homes available within the lower price ranges. The takeaway from this graph is that everything in the market is hot right now, even luxury homes!
Best Market For Selling A Home If you have some rental properties that you have considered selling, now might be a great time to unload them. Of course, they will continue to go up in value for the foreseeable future if you just want to hold on to them. This is the strongest market I’ve ever seen for selling a home for top dollar and within a predictable time frame.
The original one-page Weekly Special PDF is still available.
Get the Weekly Special Every Monday
Each Monday morning the Weekly Special takes one Tallahassee housing question, answers it with a chart of local sales, and explains what it means for your next move.
It is free, and you can unsubscribe any time.