
Weekly Special | July 19, 2021
How Often Do Home Prices Fall?
If you believe home prices cannot come down, you might end up learning a tough lesson if you were to buy a home at the wrong time. And if you believe that home prices must come down, you too might learn a tough lesson by failing to buy while homes are relatively cheap.
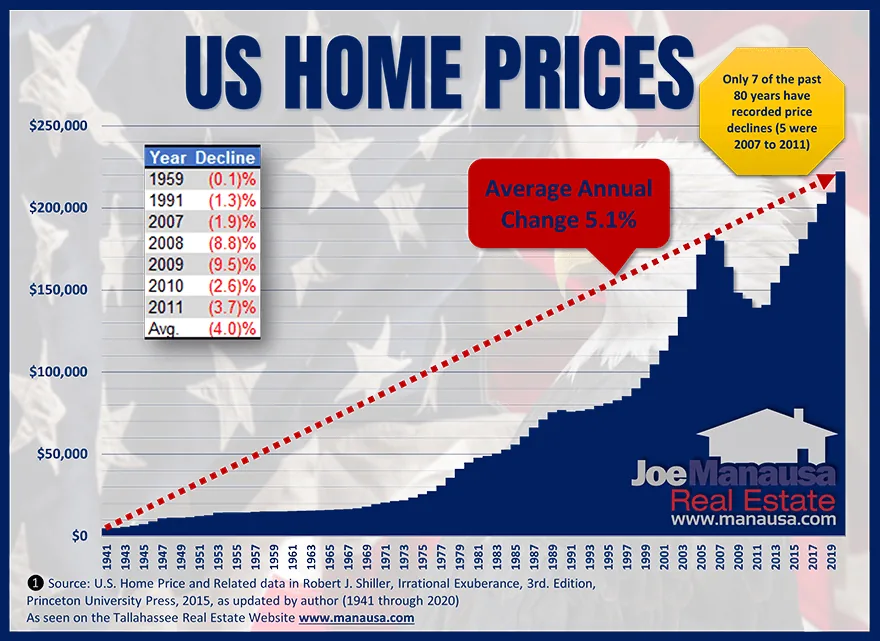
Rather than have unfounded beliefs (in either direction), why not study the past and see what it suggests will occur moving forward? In order to gain the insight that we need, I have gathered eighty years of data on US home prices so that we can examine how home prices have risen and fallen through the years.
In the past 80 years, average home prices have risen in 73 years while declining in just 7 years. In fact, five of the seven declining years were from 2007 through 2011, the result of many causes including significant over-building by us Home Builders.
From 1942 through 2006 (a 64-year span), home prices fell just twice, once for 1/10th of a percent, and once at 1.3%. Take that in. 62 years saw the average home price grow while just two years showed it decline.
History tells us that as a general rule, the average home price is going to rise. If we had social media from 1942 through 2006, how many “YouTube Experts” would have wrongfully called for falling home prices?
My advice remains unchanged: Buy as much home right now as you can handle, you might not be able to move-up later!
The original one-page Weekly Special PDF is still available.
Get the Weekly Special Every Monday
Each Monday morning the Weekly Special takes one Tallahassee housing question, answers it with a chart of local sales, and explains what it means for your next move.
It is free, and you can unsubscribe any time.