
Weekly Special | March 4, 2024
Sellers Still Control Housing Market
The US housing market has faced a severe shortage of homes for over five years. By combining supply and demand data, we have determined the months of supply of homes currently available.
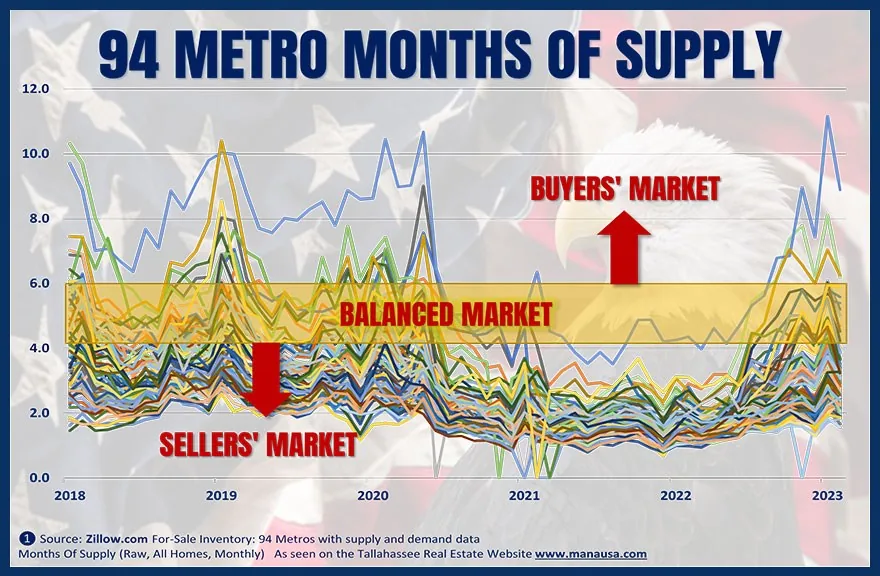
Historically, a six-month supply was viewed as balanced, indicating a state of market equilibrium. However, I now think market equilibrium is achieved with a supply of closer to four months (see why here).
This graph shows the inventory months of supply in the largest U.S. metropolitan areas, underscoring the persistent strength of a sellers’ market.
The gold band spans the graph horizontally, offering a broad estimate of market equilibrium. For those adhering to the traditional six-month supply standard, only three major metropolitan areas have shifted towards a buyers’ market.
If you consider a four-month supply as balanced, then only ten Metropolitan Statistical Areas have moved in favor of buyers. Regardless of the chosen benchmark, over 90% of Americans reside in areas dominated by a sellers’ market.
Even with falling demand, the lack of new inventory means the market dynamics for home sellers remain unchanged.
The lack of available options and the increased cost of borrowing have pushed many sellers out of the market.
Consequently, the reduced demand from these potential sellers has been offset by the simultaneous decrease in supply, keeping control of the housing market in the hands of those who want to sell.
This issue went with a longer report on our blog: read the full blog post. The original one-page Weekly Special PDF is still available.
Get the Weekly Special Every Monday
Each Monday morning the Weekly Special takes one Tallahassee housing question, answers it with a chart of local sales, and explains what it means for your next move.
It is free, and you can unsubscribe any time.