
Weekly Special | May 31, 2021
Year-To-Date Home Sales Explode Higher
Year to date home sales exploded higher with a strong May that saw year over year home sales move 27% higher. Currently, with even more home sales remaining to be entered for May, the market is already up 18% for the year.
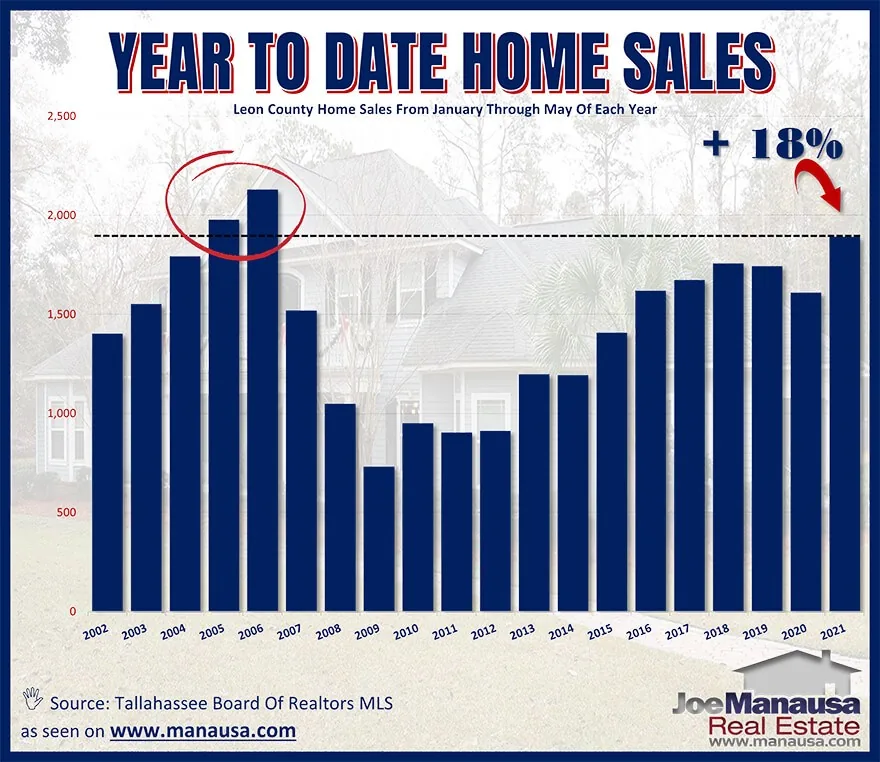
The blue bars in the graph above report the total number of homes sold from January through May each year, and it’s clear 2021 has started out strong. The red circle shows that only 2005 and 2006 had more home sales in the first six months of the year.
Right now, we are seeing heightened demand that is primarily due to historic-low mortgage interest rates, but we ARE NOT seeing growth in the inventory of homes for sale.
The supply side of the market is failing to keep pace with demand which has resulted in soaring home prices.
Expect to see more growth from this report next month, as last year COVID had a negative impact on home sales for the months of April, May, and June.
Closings in the month of July were very strong last year, so perhaps closings measured in July will be the first month of cooling since August of last year.
The original one-page Weekly Special PDF is still available.
Get the Weekly Special Every Monday
Each Monday morning the Weekly Special takes one Tallahassee housing question, answers it with a chart of local sales, and explains what it means for your next move.
It is free, and you can unsubscribe any time.