August is over, September is underway, meaning that 2/3rds of the year is now history. So how are home sales in Tallahassee?
Follow along as I walk you through current housing market conditions, mortgage interest rates, and home sales trends in 2021 when compared to previous years, each through August. Finally, my conclusion will give you an idea of where the market is heading as we begin moving towards 2022, and which factors will decide its future.
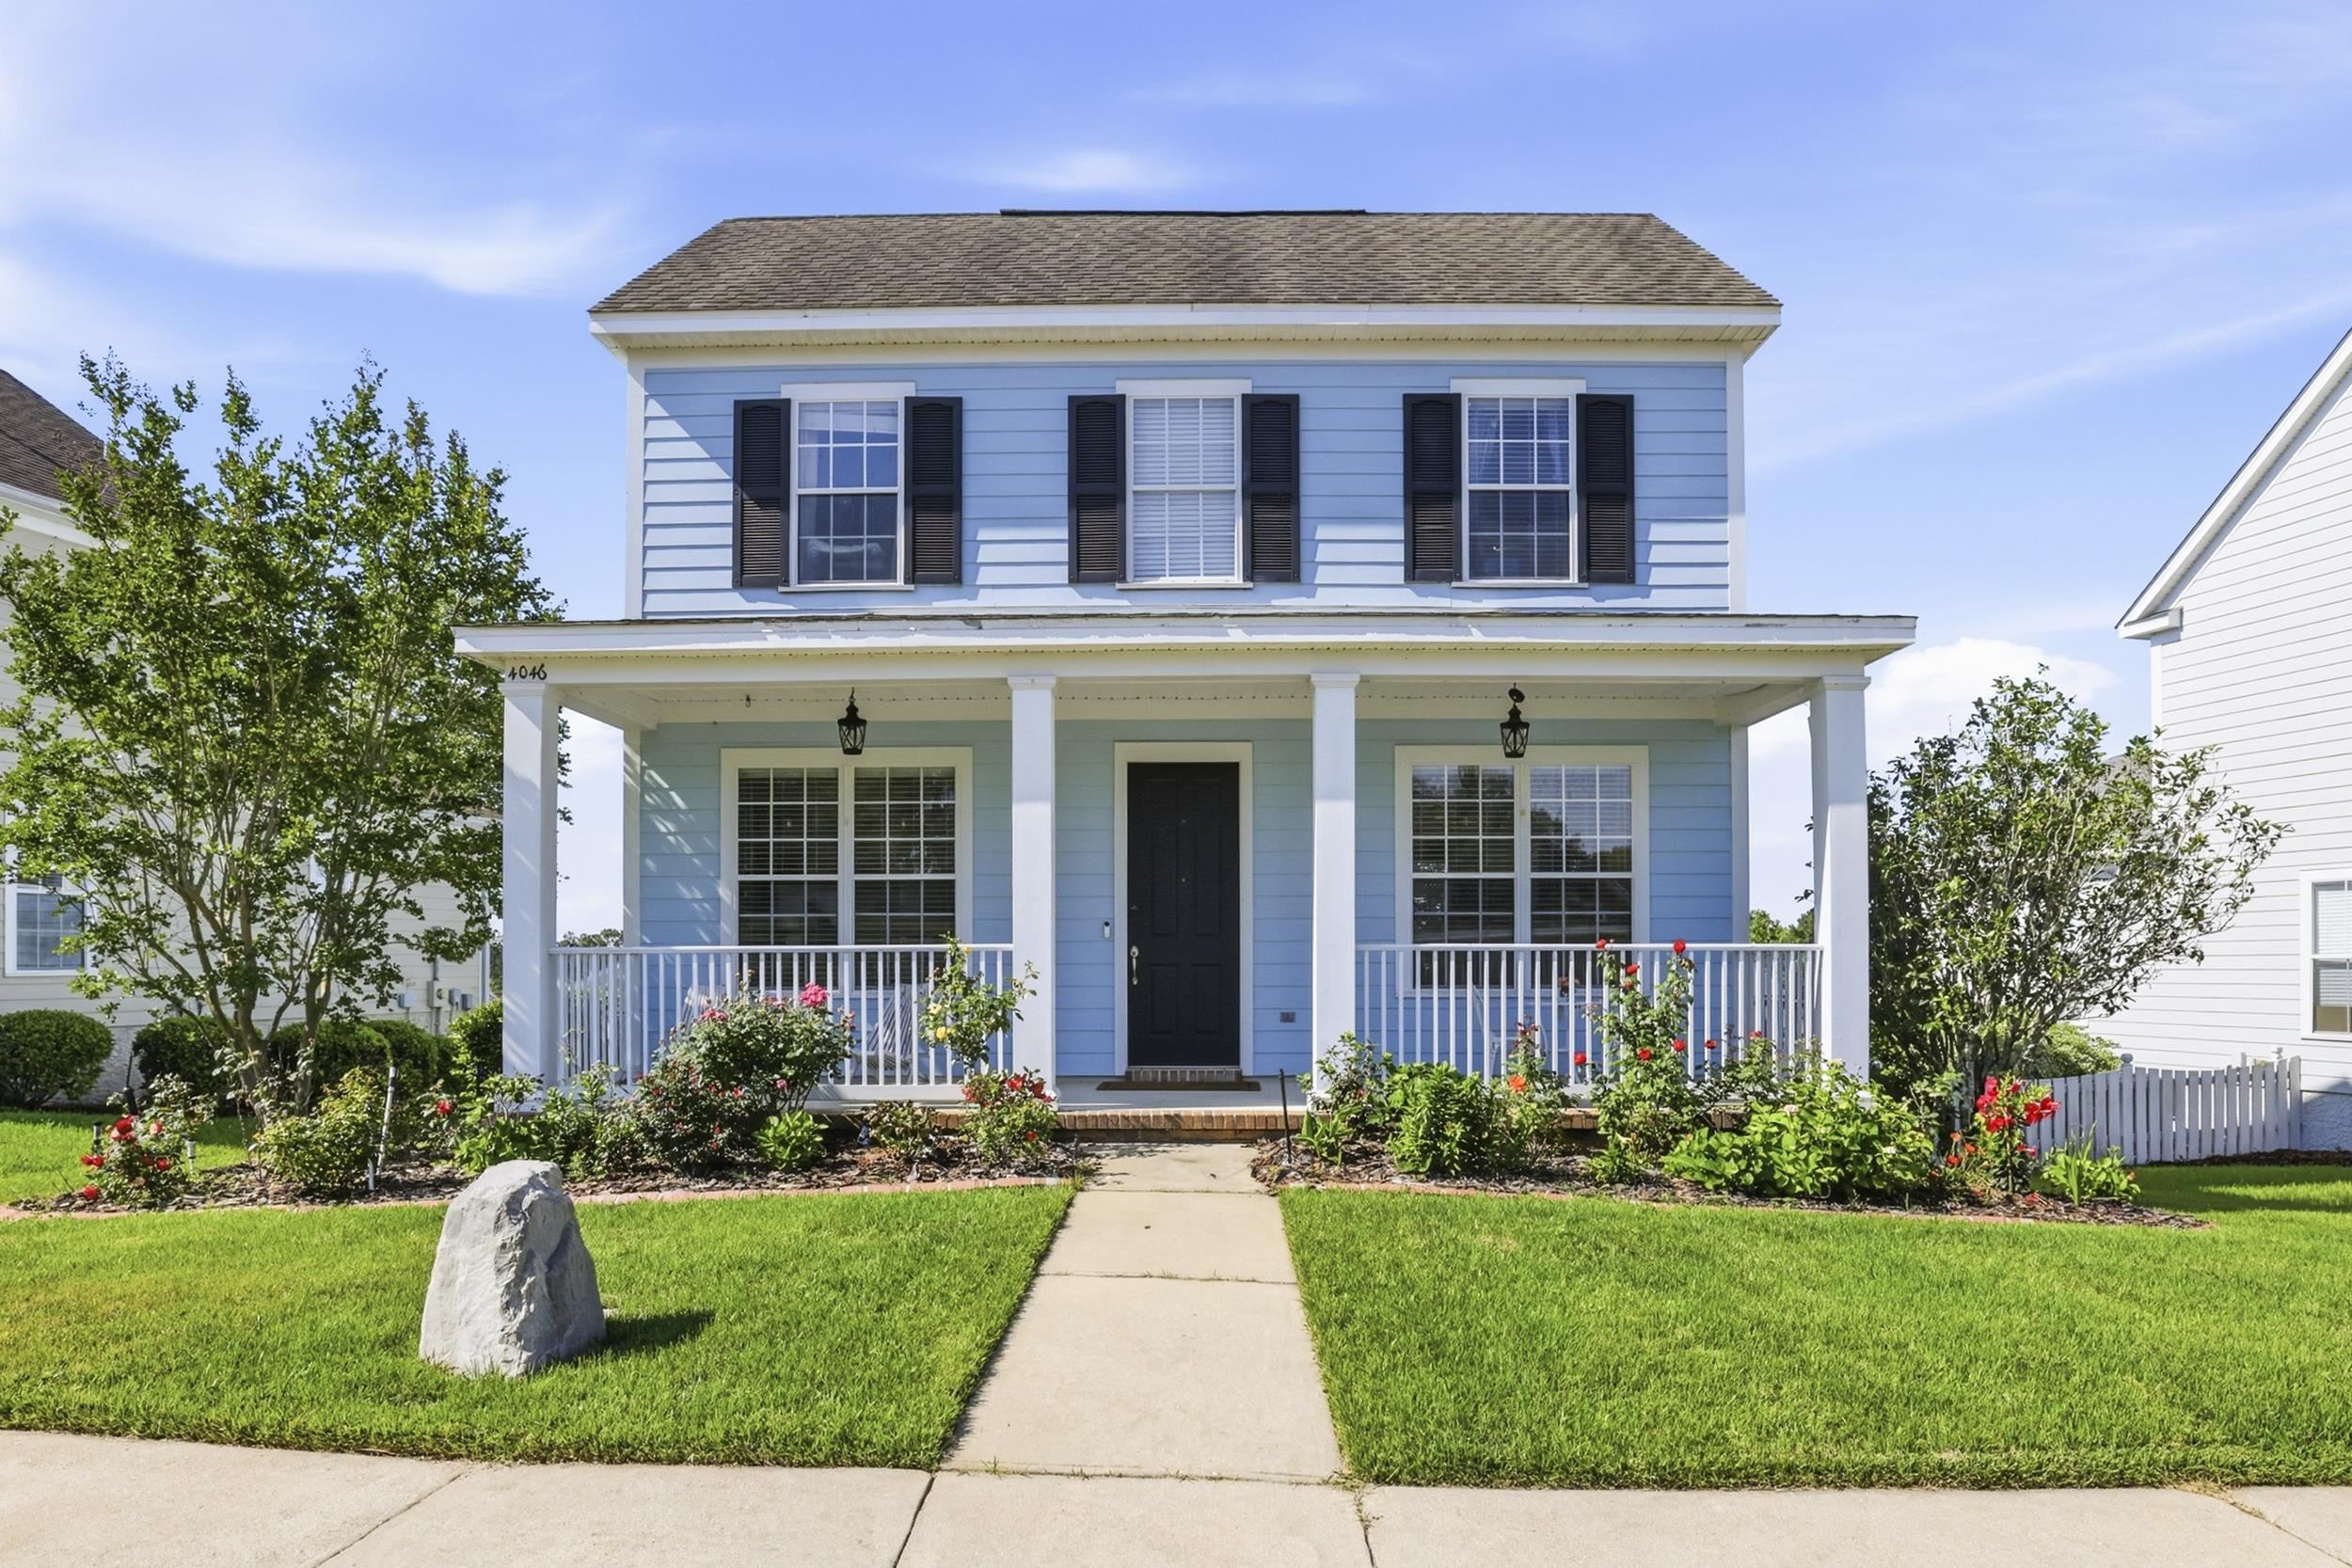
Let’s start the report with a quick look at the current listings of homes for sale in Tallahassee. They are sorted from highest to lowest price. Take a look as the asking prices decline, the percentage of homes under contract goes through the roof.
Homes For Sale In Tallahassee Today
The following list of homes is dynamically created to show only what’s available in Tallahassee right now. It’s updated every 15 minutes, so you can be assured that it’s the best information available on Tallahassee real estate listings.
I include these listings in my monthly report so that our readers can observe the record-high rate of listings already under contract with buyers.
Tallahassee Homes for Sale


Year-Over-Year Home Sales Continue With Gains
The first graph in today’s report shows how each month’s sales compared with the same month the year prior. We refer to this as year-over-year home sales.

A year-over-year home sales comparison provides insight into the market changes by removing the seasonal impact at any given time of the year.
For example, we only compare September to September or December to December, thus the seasonal changes throughout the year are not a factor.
Even a cursory glance at this graph tells you that this market is hot. Year-over-year home sales rose 19% in August and we’ve now seen twelve straight months of gains (meaning every single month over the past year was better than its corresponding month the year prior).
Year To Date Home Sales
This next graph shows the number of homes sold during the first eight months in each of the past 20 years.

Strong home sales have led 2021 to post the third-best year ever (through August), trailing only 2005 and 2006 when speculative buyers caused the market to explode.
I can tell you from the street that today’s demand, while strong, is nothing like what we saw in 2005 and 2006. I do not see nearly the number of people buying to flip, rather it is those that plan on using the home as a residency that are the primary drivers in this market.
Mortgage Interest Rates Remain Near Low
The next graph in today’s reports plots more than 50 years’ worth of average monthly mortgage interest rates, and the news is nothing but good for both buyers and sellers.

One has to wonder just how long these low mortgage interest rates will last. The blue-dashed line shows that the general decline of rates goes back forty years, and you have to wonder when rates will head into a long-term trend of generally rising mortgage interest rates.
Make no mistake about it. We are in a mortgage-interest-rate driven market right now. People understand that rates today are likely to be lower now than they will ever see for the rest of their lives, so they are buying homes to lock in the deal of a lifetime.
Status Of Current Home Listings
This next graph shows a breakdown of the current home listings today. Homes for sale that are not yet under contract with buyers are plotted in red, while homes for sale that ARE under contract with buyers are plotted in blue. The green line reports the percentage of homes listed that are under contract, while the dash-green line shows the one-year trend of this under-contract percentage.

Roughly 3 of every 5 homes listed for sale right now are already under contract with buyers. The green line in the graph above shows that 59% of the current listings are already under contract, and the one-year trend of the under-contract percentage is at an all-time high of more than 56%.
The reason that we plot the one-year trend of the average (dashed-green line) is to ensure we understand the true direction of the inventory status changes. For example, the solid-green line has been declining for the past three months, so you might think we’re seeing the market shift to a less-frenzied state.
In fact, I recently read an article where somebody claimed that to be the case in the US market. But people like that fail to understand the seasonal impact on both listings and sales in the market. Take a look at the dashed-green line that has been rising. Here’s what this reveals:
In most years, we see the number of fresh new listings rise faster than demand during the months of June, July, and August. This normal seasonal increase in supply has brought the under-contract percentage down for the past three months, but the current percentage is higher than it was at this time last year. So the declines that we are seeing are seasonal, the market is actually moving further into a scarcity of supply.
To better understand what this means exactly for today’s buyers, let’s compare today’s market with what buyers were seeing at the beginning of this graph in 2011.
As I produce this report, there are 1,232 homes for sale in Leon County, but only 534 of them are really available as buyers have the other 698 already under contract with buyers.
So a buyer today has just 534 homes available to purchase. At this time in 2011, there were nearly 1,800 homes available, and there were far fewer buyers looking at them. The competition for the few homes is so high today, buyers don’t have time to think, they must react fast when a new home hits the market.
This means today’s buyers have to be prepared well ahead of time. If you go looking at houses before you get your finances in order, expect to be heartbroken. You will lose out on the home you love, only to find homes more expensive once you get your affairs together.
Smart sellers are taking cash offers (or offers with limited financing contingencies), so forget about getting your dream home with a contract that asks the sellers to wait for you to find financing. Again, get your loan documents completed before looking at homes, it’s the only way to entice a seller to take your offer.
I strongly encourage all buyers to meet with a buyer’s agent to put together a complete acquisition plan so that when the right home is found, you have a fair opportunity to get it. Remember, other buyers will be bidding on the home too, so you have to appear strong so that the seller will consider your offer.
Recent Housing Market Reports

Tallahassee Housing Economic Update

Tallahassee Florida Spring Economic Update

Tallahassee/US Housing Market Update Feb 2024

Which Home Sizes Are Skyrocketing In 2024?

Top 10 Neighborhoods to Live in Tallahassee for Families

Wealth Gap Widens Luxury Home Market Booms Unprecedentedly

How Bad Is It? SHOCKING Building Permits Report!

Top 10 Patio Home Neighborhoods In Tallahassee

Existing Homes Update - Tallahassee Real Estate
Annual Real Estate Appreciation
For the first ten or so years of my career, we saw real estate appreciation average a little more than 3% each year. But the craziness of the housing market in the early 2000s has created chaos ever since and has lead to a market appreciation that is soaring today.
The best way to measure real estate appreciation across the market is to measure the change in the median existing home value each year. We simply record the price per square foot of each home sold, sort them by this measurement, and then choose the one in the middle for each year.

The graph above plots the change in the median home value each year. Blue bars show growth, red bars show declines.
The graph shows clearly that the rampant appreciation that began last year has continued. In an earlier market report, I had forecast double-digit appreciation for 2021. Through 2/3rds of the year, appreciation is more than 9.7% (an annualized rate of nearly 15%).
It wouldn’t take too many years at this appreciation rate to render the Tallahassee housing market “unaffordable,” creating a situation where only the wealthiest among us could afford to buy a home. Needless to say, this is not good! If you want to know more about home affordability, I recommend you read this article that I produced last month.
Median Home Price
Having seen that the current market appreciation rate shows the median existing-home value has risen nearly 10% thus far in 2021, let’s explore what that has done to the median home price.

This graph shows the median home price each year (the median is not the average, rather it is the price of the home in the middle when all homes are lined up according to each sales price).
This graph shows the rapid rise in home prices. The median home price for existing homes is $226,950, for new homes the median has shot up to $323,400, and overall, the median home price in Tallahassee is $240,000. Considering our median home price was below $200,000 as recently as 2018, it’s not hard to see how home prices are getting out of control.
Fortunately for buyers, interest rates remain low enough that the monthly payment to carry the median home is better today than what it has been in all but 9 of the past thirty years! But this is a short-term opportunity (unless you believe interest rates will move lower to continue covering the rising cost of homes).
Inventory Moves Fast In Today’s Housing Market
Up to this point, we’ve seen that the supply of homes for sale is far too low and the competition for available listings is fierce among buyers. Our next graph serves to demonstrate how this dynamic disrupts the home buying experience.
The graph shows the percentage of homes sold each month. During normal market conditions, roughly 1/6th of the homes sell each month (see the red shaded field in the middle of the graph). But look to the right side of the graph, today’s market is now more than doubling that amount.

A red dot is plotted each month to show the percentage of the inventory that sold. If there were no seasonality in real estate, we would expect to see about 1/6th of the homes sell each month (16.7%).
As seasonality is real, we actually expect to see roughly 4 months above normal, 4 months near normal, and four months below normal during a typical year. This graph makes it clear, this is not a typical year!
When the market was coming out of its collapse, we went more than 8 years without a single month landing within the “normal” range. There were just too many homes on the market and it was common for fewer than 1/10th of them to sell each month.
Now, low inventory levels have created the opposite effect. More than two of every five homes listed for sale sold over the past six months. That means when buyers go looking at homes, there is not much out there that is not already under contract with other buyers.
The Housing Market In September
The housing market is insanely one-sided right now, with far more buyers than sellers. If you have a home to sell and pre-market it correctly, you will get offers on the first day your home is available to be seen. Ensure your broker uses an omnichannel marketing plan with an emphasis on pre-marketing and you’ll be able to choose from the multiple offers that you receive.
When mortgage interest rates rise, it will have an immediate and significant impact on demand if they rise too quickly.
The luxury homes market could very well go dormant, as it has been super-hot over the past few years (setting an all-time high in 2020). The top-end of the market is most susceptible to collapse due to rising mortgage interest rates, so high-end sellers need to “make hay while the sun is shining!).
So long as rates rise gradually, we’ll see demand cool in the market, but not in a damaging way. The lowered demand will increase the relative supply of homes and hopefully slow the out-of-control appreciation of home values. I would expect to see this happen fairly soon if the fed sees any signs of inflation, but forecasting the future of mortgage interest rates is highly speculative.
Real estate market conditions make it the best time I’ve seen in my 30 years selling homes in Tallahassee to sell a home within a predictable time frame. If you are wanting to move, do so now so that you can sell your current home fast and get into your new one financed at a rate below 3% for a 30-year loan!
Top Tips For Home Sellers


How To Sell Your House On Your Own

10 PROVEN Strategies To Increase A Home's Selling Profit
2025s HOTTEST Home Selling Strategies You Need NOW
The 3-DAY Method To Sell Your Home For More (2025)

The Best Time To Lower The Price In A Home Sale

How FOMO Makes Your Home Sale More Profitable

Home Sale Sabotage: Top 10 Mistakes Sellers Make
When moving to, in, or from Tallahassee, you will fare better if you work with a local expert. We are here to help. If you have further questions on the Tallahassee real estate market, you can leave a comment below, give us a call at (850) 366-8917, or drop us a note and we'll give you the local information needed to ensure a successful, smooth transaction.
As a local born and raised in Tallahassee with a focus on customer service, I promise you'll find great success when working with Joe Manausa Real Estate, just as have our past customers. You can read thousands of their reviews reported on Google, Facebook and Zillow right here: Real Estate Agent Reviews Tallahassee.
 Have you heard about my new book "The Business of Getting Business?" It's a comprehensive guide for small businesses to help them make the move to digital. For those of us who want to survive and thrive in a world where large corporations are taking over, it is a must-read. It's also the perfect guide for how to sell a home in the digital age. You can find The Business Of Getting Business by clicking on any of the trusted retailers below.

Think all REALTORS are alike?
Read what people are saying about working with Joe Manausa Real Estate! You can see thousands of real customer reviews reported on Google, Facebook and Zillow at this link: CLICK HERE FOR REAL ESTATE AGENT REVIEWS.