
Weekly Special | July 25, 2022
Big News In Housing – Supply Rises
The blue bars in this graph measure the supply of homes for sale each month in the US, while the red line calculates the months of supply of homes. The dashedgray line measures the one-year trend of the months of supply, and right now the supply of homes has slightly moved above the all-time low.
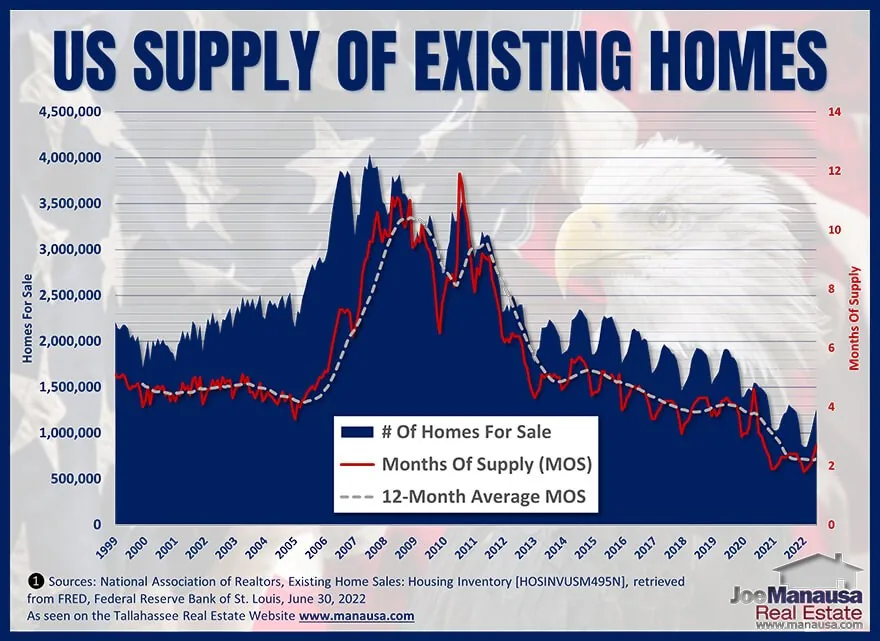
Here is what you must understand about the supply and demand for homes today. Number one, the number of homes on the market remains near an all-time low, and number 2, the year-over-year supply of homes for sale actually rose in June.
That’s right, and this is big news, the month of June was the first month that the year-over-year supply of homes rose higher since May of 2019, ending more than three straight years of declining inventory. In the past, I have always told readers I would announce market changes, and for the housing market to become oversupplied, we first had to see supply start to rise. It finally has. But this is just possibly the first very small step.
To put today’s supply of homes into perspective, let’s compare June’s supply with the supply of homes recorded during the months of June in past years:
1 Year Ago – Up 2.4% 2 Years Ago – Down 18.2% 3 Years Ago – Down 34.4% 4 Years Ago – Down 34.7% 5 Years Ago – Down 35.1% 6 Years Ago – Down 40.3%
The original one-page Weekly Special PDF is still available.
Get the Weekly Special Every Monday
Each Monday morning the Weekly Special takes one Tallahassee housing question, answers it with a chart of local sales, and explains what it means for your next move.
It is free, and you can unsubscribe any time.