
Weekly Special | November 15, 2018
Will Reduced Purchasing Power Slow The Market?
The Tallahassee housing market is cooling off, but home sales continue to be stronger in 2018 versus the same months in 2017.
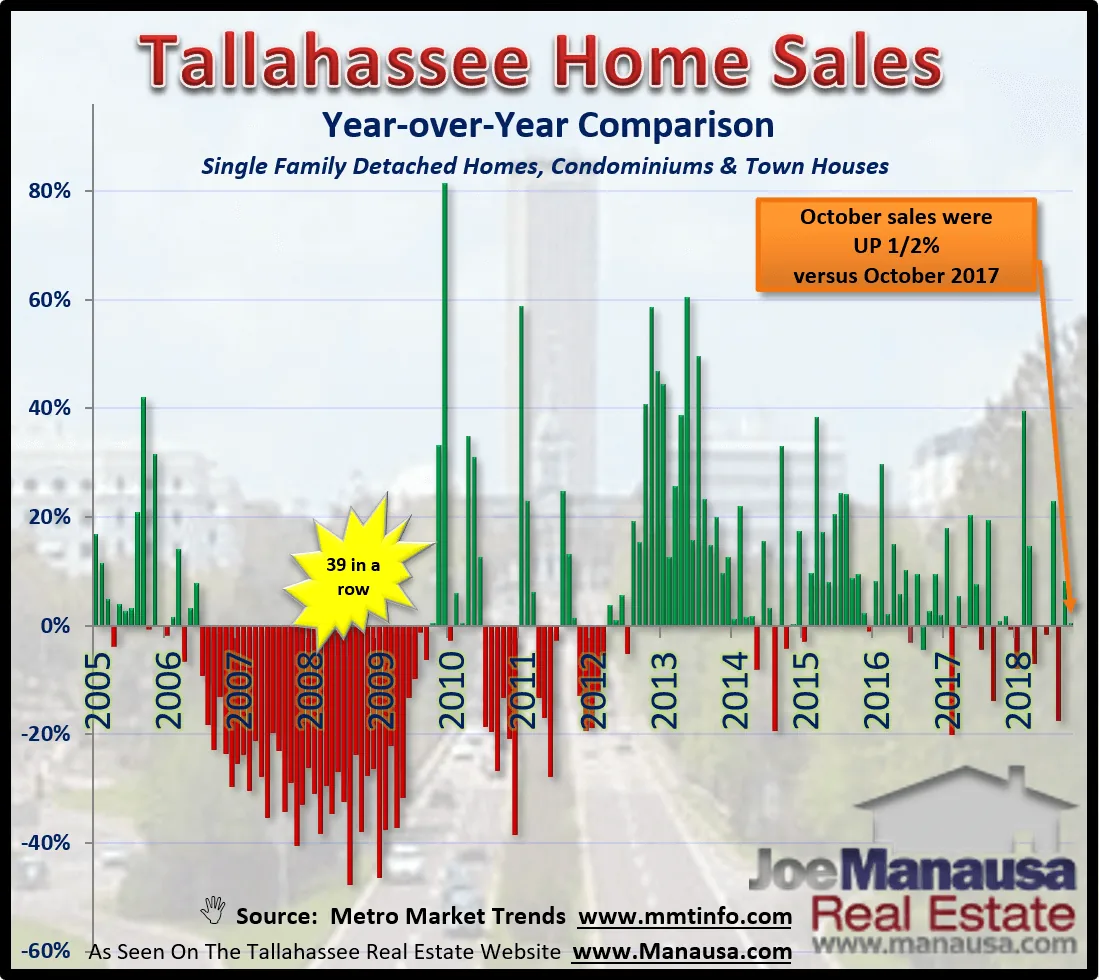
The graph above shows year over year homes sales, which is a method of tracking change in the market. The green vertical lines occur when a month shows more home sales than that same month in the prior year, while red vertical lines show declines.
Through ten months of 2018, there have been four months that declined versus those same months in 2017, while there have been six months that recorded growth.
Overall, there have been 3.3% more home sales in 2018 through October than there were through October of 2017. The growth rate of the housing recovery has been slowed by a combination of declining inventory, rising mortgage interest rates, and a healthy dose of buyer “sticker shock” as home prices in many neighborhoods have moved as much as 10% higher than when most current buyers started thinking about buying less than a year ago. Expect continued slowing as the market responds to the higher cost of funds and reduced purchasing power.
The original one-page Weekly Special PDF is still available.
Get the Weekly Special Every Monday
Each Monday morning the Weekly Special takes one Tallahassee housing question, answers it with a chart of local sales, and explains what it means for your next move.
It is free, and you can unsubscribe any time.