
Weekly Special | December 17, 2018
Year Over Year Home Sales Get Slammed
Year over year home sales fell a whopping 25% in November when compared to November a year ago.
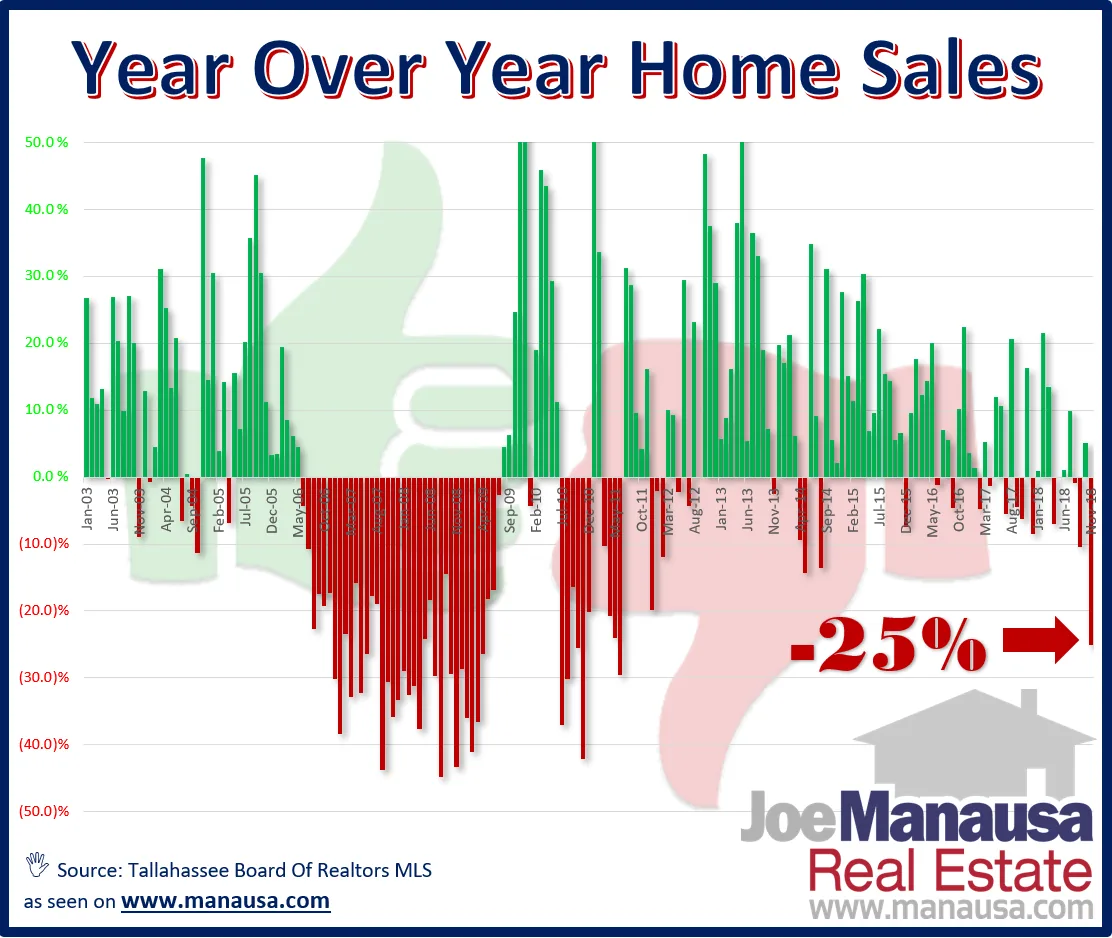
I assembled this graph with information provided by the Tallahassee Board of Realtors MLS, meaning it does not include sales that occurred outside of the MLS.
Plotting year over year home sales is a method of tracking the change in the market; it removes seasonal effects as it always compares the recent month with the same month last year. The green vertical lines show when a month shows more home sales than that same month in the prior year, while red vertical lines show declines.
Is The Market Cooling?
The short answer to this is “yes,” the market is cooling. Rising prices, coupled with higher mortgage interest rates, have slowed buyer activity. We started seeing this on the street in August.
The long answer includes some impact from hurricane season. Hurricane Michael caused more than a week (1/4) of sales to stop this year, and those results were felt in November closings.
Last November’s closings were strong due to Hurricane Irma being earlier in the year which pushed the growing demand to November closings. Expect 2018 to close very near 2017 totals.
The original one-page Weekly Special PDF is still available.
Get the Weekly Special Every Monday
Each Monday morning the Weekly Special takes one Tallahassee housing question, answers it with a chart of local sales, and explains what it means for your next move.
It is free, and you can unsubscribe any time.