
Weekly Special | April 8, 2019
March Year Over Year Home Sales Drop 20%
Year over year home sales fell 20% in March when compared to March in 2018.
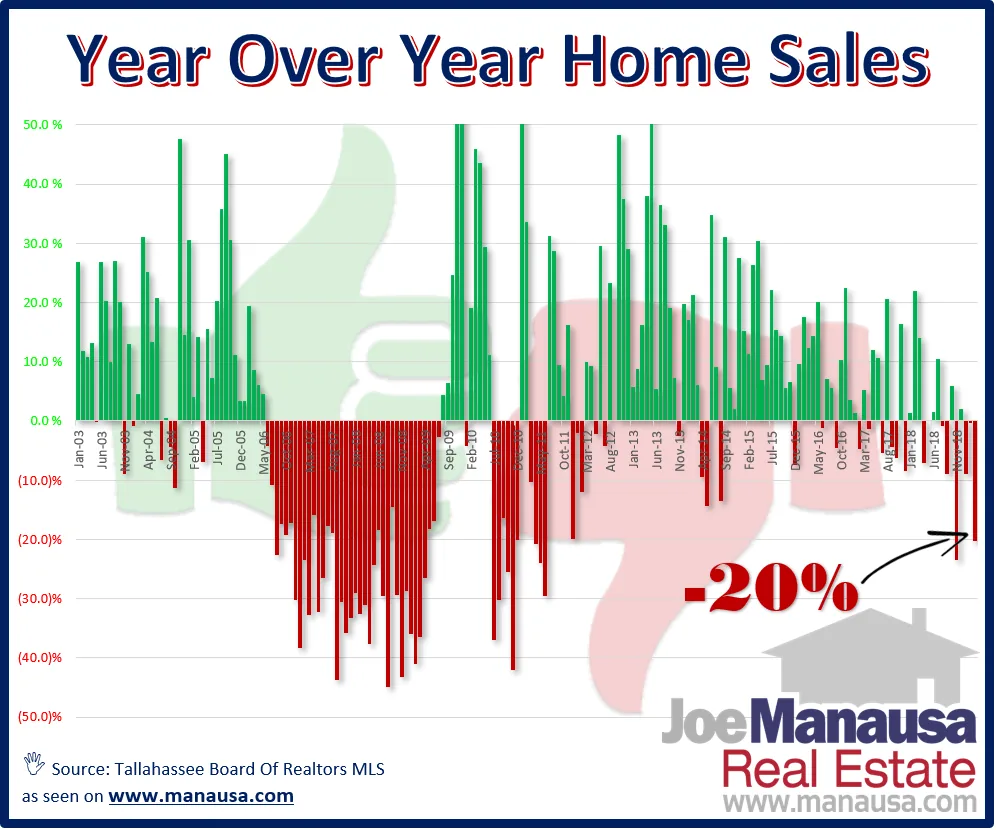
I assembled this graph with information provided by the Tallahassee Board of Realtors MLS, meaning it does not include sales that occurred outside of the MLS.
Plotting year over year home sales is a method of tracking the change in the market; it removes seasonal effects as it always compares the recent month with the same month last year. The green vertical lines show when a month records more home sales than that same month in the prior year, while red vertical lines report declines.
Not As Bad As It Seems March represents the third straight month of declines, something we’ve anticipated after seeing so many months of continual improvement over the past few years. But was there is something this graph does not show.
Last year, I sold a condominium complex of 56 units in March. It was properly recoded as 56 individual sales, but one buyer purchased the entire complex. If we remove that sale from last March’s numbers, then we saw about an 8% decline in March instead of 20%.
Either way, sales are down. Overall, we saw sales decline about 11% in the first quarter compared to Q1 2018.
The original one-page Weekly Special PDF is still available.
Get the Weekly Special Every Monday
Each Monday morning the Weekly Special takes one Tallahassee housing question, answers it with a chart of local sales, and explains what it means for your next move.
It is free, and you can unsubscribe any time.