
Weekly Special | July 24, 2016
Year Over Year Home Sales Rise 10% In June
June unit home sales rose 10% when compared to June 2015. This is the 6th consecutive month of improving year over year home sales.
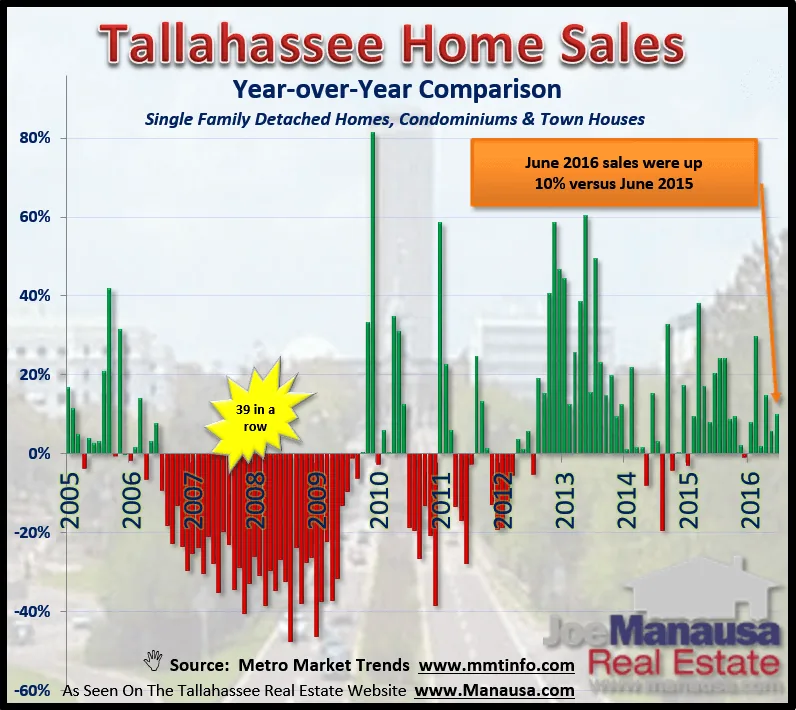
This means that 42 of the past 47 months have shown improvement over their year-prior numbers, a wonderful sign of the continually improving trends in the Tallahassee real estate market.
In the graph above, the horizontal axis represents “no change” when comparing a month to it’s corresponding month from the previous year. A green vertical bar measures positive change, while a red vertical bar measures negative change.
Lately, there has been a sea of green.
The MLS is actually reporting a decline in June, which helps underscore the importance of looking beyond Realtor sales to get the full picture of the Tallahassee housing market. The graph above contains information from both Realtor sales and non-Realtor sales.
I would expect that year over year figures will remain mostly positive in the months moving forward, though we should likely expect one or two months to underperform due to the strong finish that we saw last year.
The original one-page Weekly Special PDF is still available.
Get the Weekly Special Every Monday
Each Monday morning the Weekly Special takes one Tallahassee housing question, answers it with a chart of local sales, and explains what it means for your next move.
It is free, and you can unsubscribe any time.