
Weekly Special | August 12, 2018
Home Sales Bounce Back In July
Year over year home sales surged 8% higher in July when compared to July of 2017, pushing the overall Tallahassee housing market up 4% in unit sales for the year.
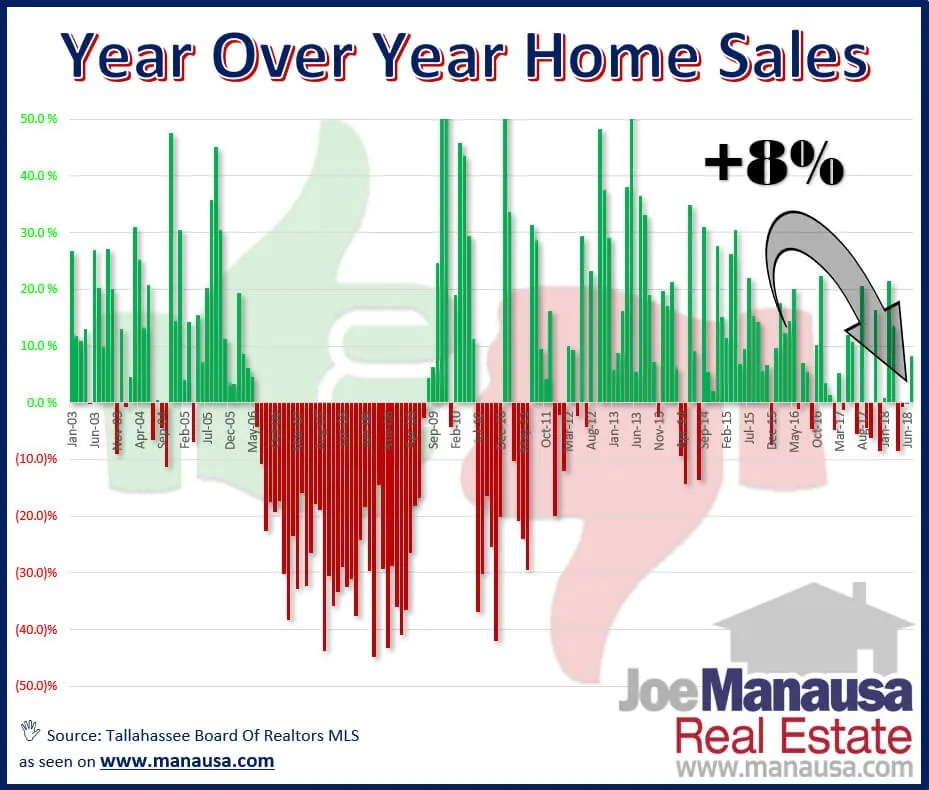
The graph above was assembled with information provided by the Tallahassee Board of Realtors MLS, meaning it does not include sales that occurred outside of the MLS.
Year over year home sales compares each month’s home sales with the same month from the prior year. Green lines indicate growth, while red lines show declines.
There have only been 13 declining months since the end of 2012, but their frequency is increasing.
The growth rate of the housing recovery has been slowed by declining inventory and rising mortgage interest rates, yet demand still appears to be strong.
With declining inventory, we look to local homebuilders to bring more housing units to the market.
Expect to see a balance between growth and declines for the foreseeable future, as local builders are not showing signs of bringing new inventory to the market at rates high enough to meet demand (and far less slower than what we saw in the 70’s, 80’s, and 90’s.
The original one-page Weekly Special PDF is still available.
Get the Weekly Special Every Monday
Each Monday morning the Weekly Special takes one Tallahassee housing question, answers it with a chart of local sales, and explains what it means for your next move.
It is free, and you can unsubscribe any time.