
Weekly Special | November 19, 2017
Cost Of Construction Creates Twist In Demand
There is a segment of our housing market that is dealing with an interesting dynamic which is likely to stabilize home values for a lengthy period of time.
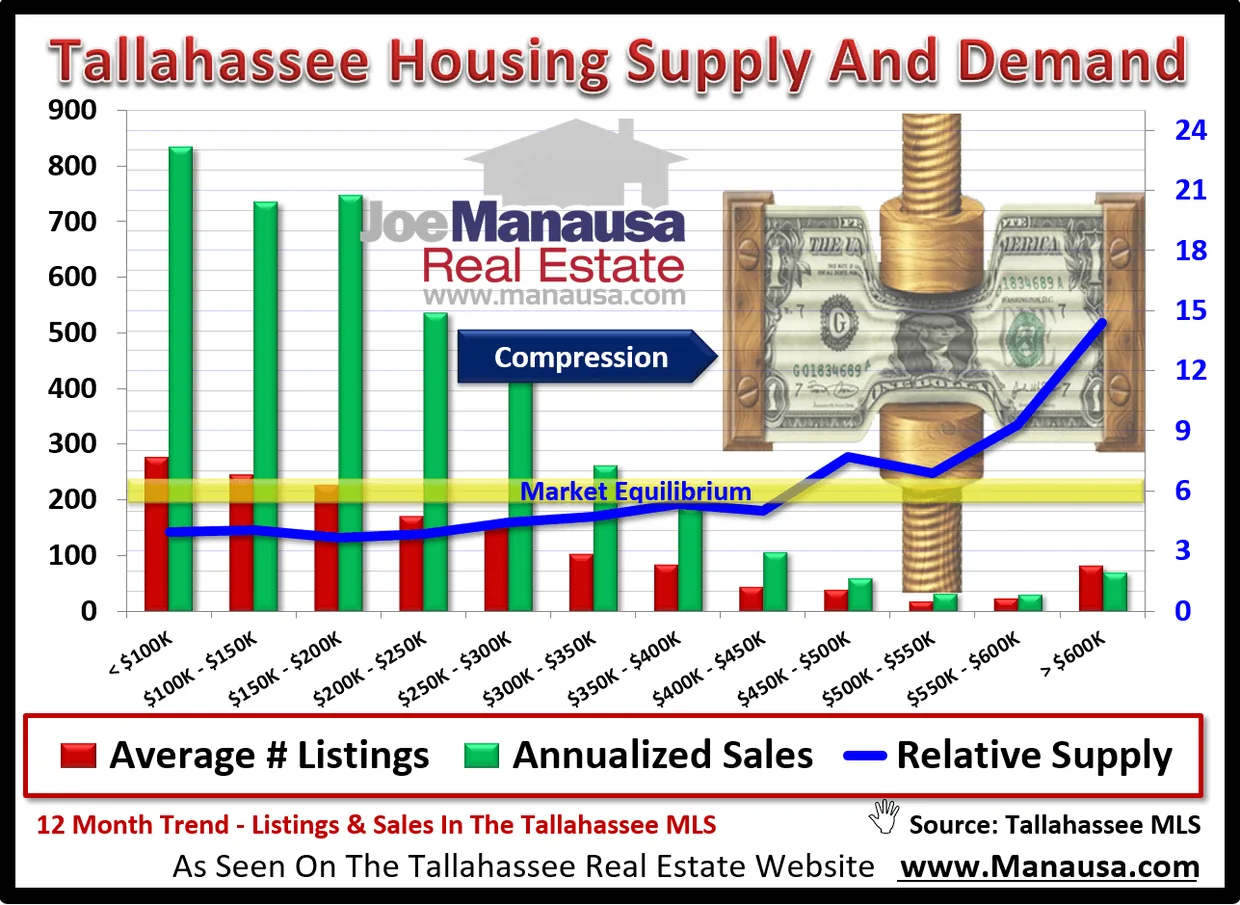
The graph above shows the average number of listings each month by price range, the total number of homes over the past year within the same price ranges, and the measure of the relative supply of homes (measured in months of supply).
The blue line represents this relative supply of homes. The yellow band is the “normal” range, which we refer to as market equilibrium because sellers and buyers (within this range) are negotiating on equal footing.
Below the yellow band is a seller’s market where demand far-outweighs supply, and the opposite is true above the yellow band.
The problem right now in real estate is builders cannot build what the market is demanding, so they build at the higher end of the price range. This is adding to the supply at the top 5% of the market and doing little for the demand south of $200K.
When interest rates rise and demand at the highest end cools, we will have 10+ years of supply of these homes, while at the low end shortages will remain.
Market Will Shift To Multi-Family The solution in Tallahassee will mirror solutions found in other metro areas. Builders will require multi-family in order to deliver product affordably.
This issue went with a longer report on our blog: read the full blog post. The original one-page Weekly Special PDF is still available.
Get the Weekly Special Every Monday
Each Monday morning the Weekly Special takes one Tallahassee housing question, answers it with a chart of local sales, and explains what it means for your next move.
It is free, and you can unsubscribe any time.