
Weekly Special | August 12, 2017
More Money … Same Time For Sellers
After so many years where it was not “good” to be a home seller, market cycles have come around for homeowners.
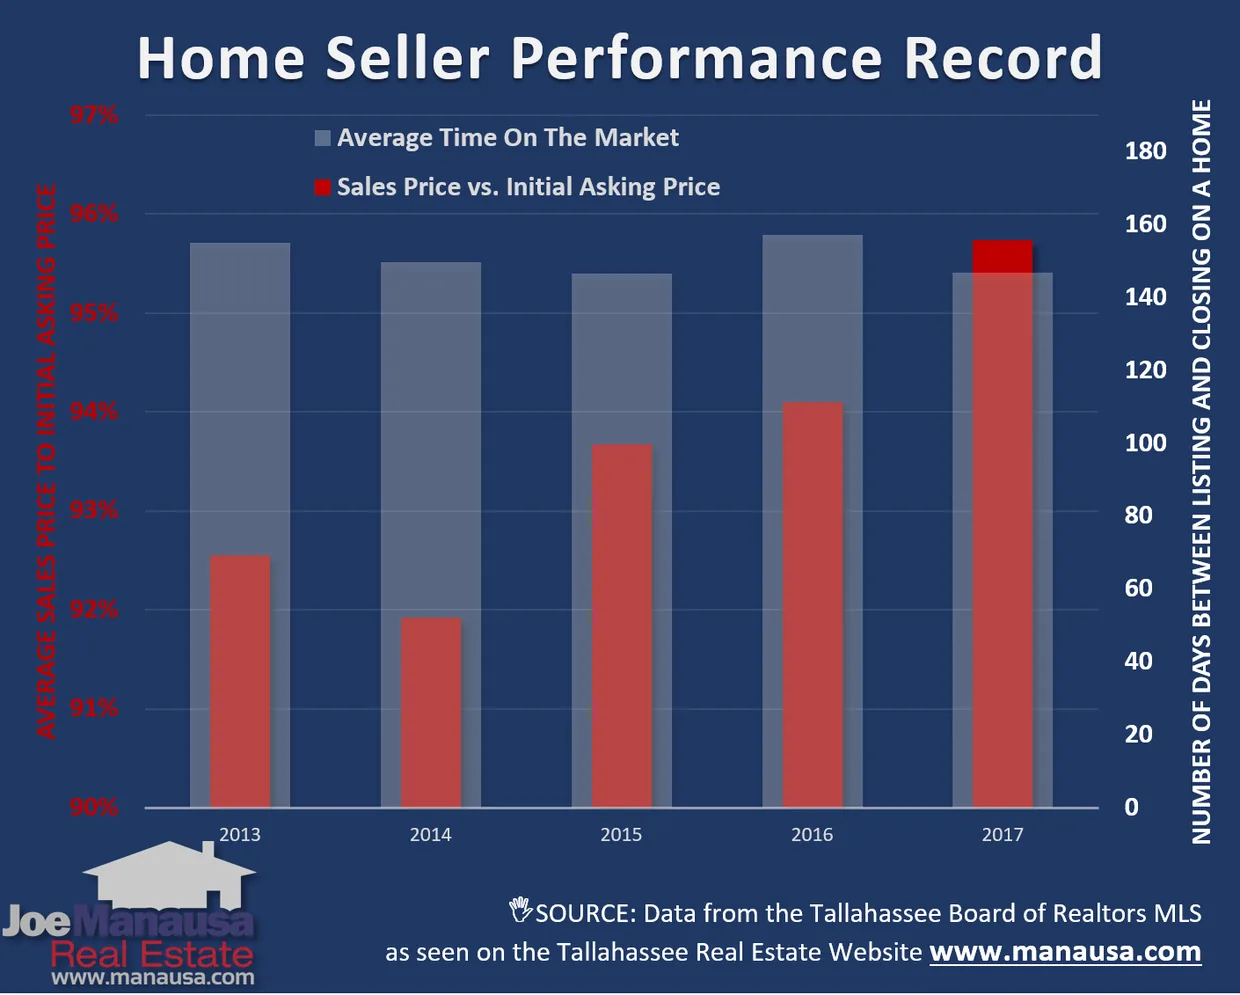
The graph above shows two pieces of information that are important for prospective home sellers, one that is good, and another that is surprising.
First of all, sellers are getting a higher percentage of their initial asking price today than they have in any of the past five years.
The red columns in the graph above shows the ratio of sales price to the initial asking price (the price the sellers were asking when they first hit the market). Thus far in 2017, the average sales price to initial asking price has been 95.7%, up from a low of 91.9% recorded in 2014.
The light colored columns reveal an interesting trend for home sellers. Apparently, the length of time it takes to sell a home has changed very little over the past five years, where we have seen the average fluctuate only 11 days when measuring from the first day in the MLS until the date of closing (typically, just a few days short of five months).
What is not shown in this graph is that sellers who price their homes tactically sell faster and for more money than those who aim high and continually reduce their asking price. Want proof? Just give us a call and we’ll show you!
This issue went with a longer report on our blog: read the full blog post. The original one-page Weekly Special PDF is still available.
Get the Weekly Special Every Monday
Each Monday morning the Weekly Special takes one Tallahassee housing question, answers it with a chart of local sales, and explains what it means for your next move.
It is free, and you can unsubscribe any time.