
Weekly Special | February 17, 2018
How Abnormal Are Today’s Inventory Levels?
The inventory of homes for sale in Tallahassee continues to decline to levels that I have not seen in my 27 years of selling homes here.
In fact, inventories are so low that buyers are now in serious competition for new listings (at most price ranges) when they enter the market. Buyers who fail to react decisively to properly priced new listings are missing out to buyers who are better prepared.
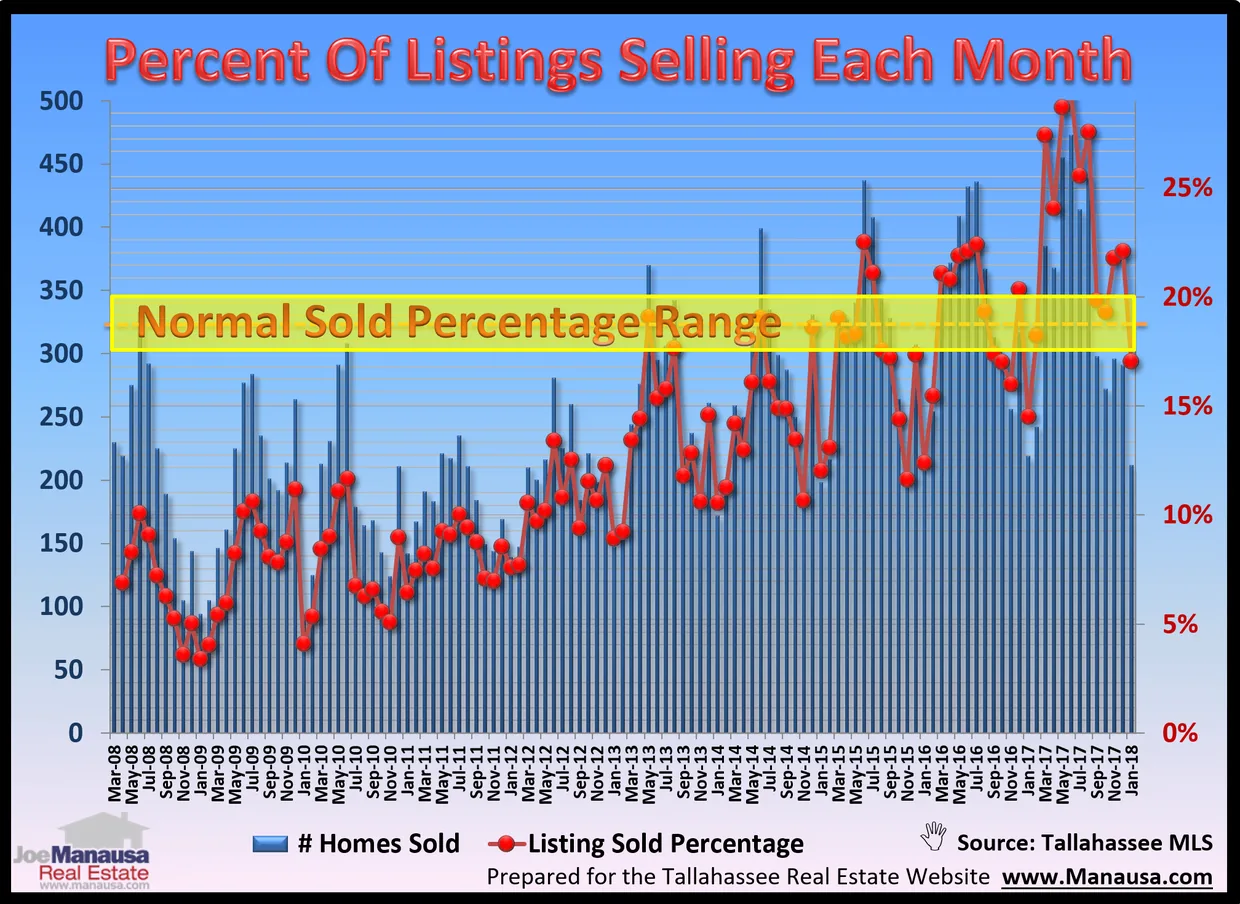
The graph above is my way of comparing the number of home sales each month to what a “normal” month would be.
Since we define a balanced market (normal) as six months of supply, I have created the “Normal Sold Percentage Range” in yellow to compare with monthly sales.
When home sales are less than 1/6th the (then) current inventory, the result is below the yellow field. The opposite is true above the yellow field, while “normal” months fall within that yellow area.
In a “normal” year, we would expect about half the months to be above the zone, while a third would be below it and a third would be above it.
The graph above shows (over the past year) 7 months above the zone, 3 within it, and 2 below.
This is yet more evidence that we are consuming inventory faster than it is entering the market, and it certainly explains why the current inventory of homes for sale is too small to meet the growing demand from homebuyers in Tallahassee.
The original one-page Weekly Special PDF is still available.
Get the Weekly Special Every Monday
Each Monday morning the Weekly Special takes one Tallahassee housing question, answers it with a chart of local sales, and explains what it means for your next move.
It is free, and you can unsubscribe any time.