
Weekly Special | February 25, 2019
New Homes Are A Driver In Value Growth
Last week we reported a new record high in home prices, this week we’ll look at one of the driving forces for rising prices.
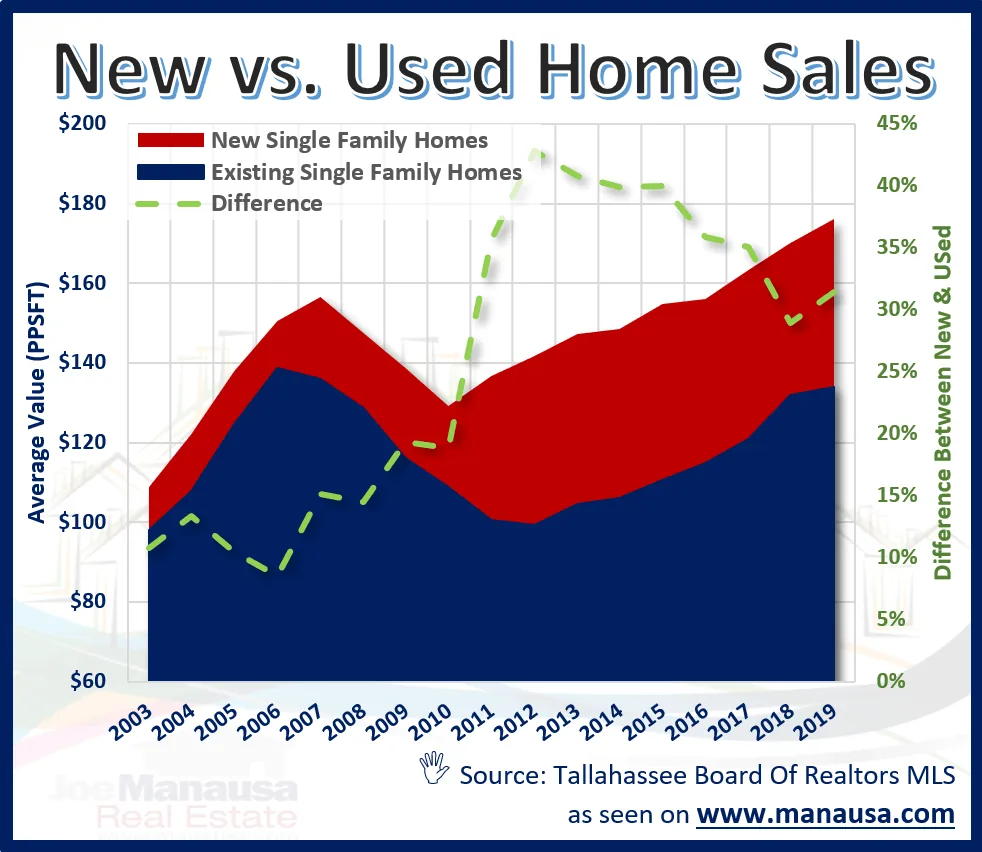
Inventory is too low so builders are finding success producing new homes. The graph above shows how existing home values have been trailing and tracking new home values.
The average price per square foot of existing home sales is shown in blue, while the same for new homes is shown in red. The difference between the two is shown as a dashed line and recorded on the right vertical axis.
I find it interesting that the value difference between new and used homes during the housing expansion phase (2003 through 2006) was roughly 10%. For the next four years, there were a lot of new construction distressed sales, but the difference jumped to nearly 20%. Once the excess inventory of new homes was depleted, the difference between new and used jumped as high as 43%.
Home construction is not going to get any cheaper, but I expect to see more condos and townhouses and fewer detached homes as a ratio in what is built, thus we’ll see developers control costs through smaller land plots and lower effective building costs.
The original one-page Weekly Special PDF is still available.
Get the Weekly Special Every Monday
Each Monday morning the Weekly Special takes one Tallahassee housing question, answers it with a chart of local sales, and explains what it means for your next move.
It is free, and you can unsubscribe any time.