
Weekly Special | November 26, 2016
Housing Recovery Differs Across Tallahassee
The rate at which the housing market recovery is progressing through each neighborhood in Tallahassee is not consistent.
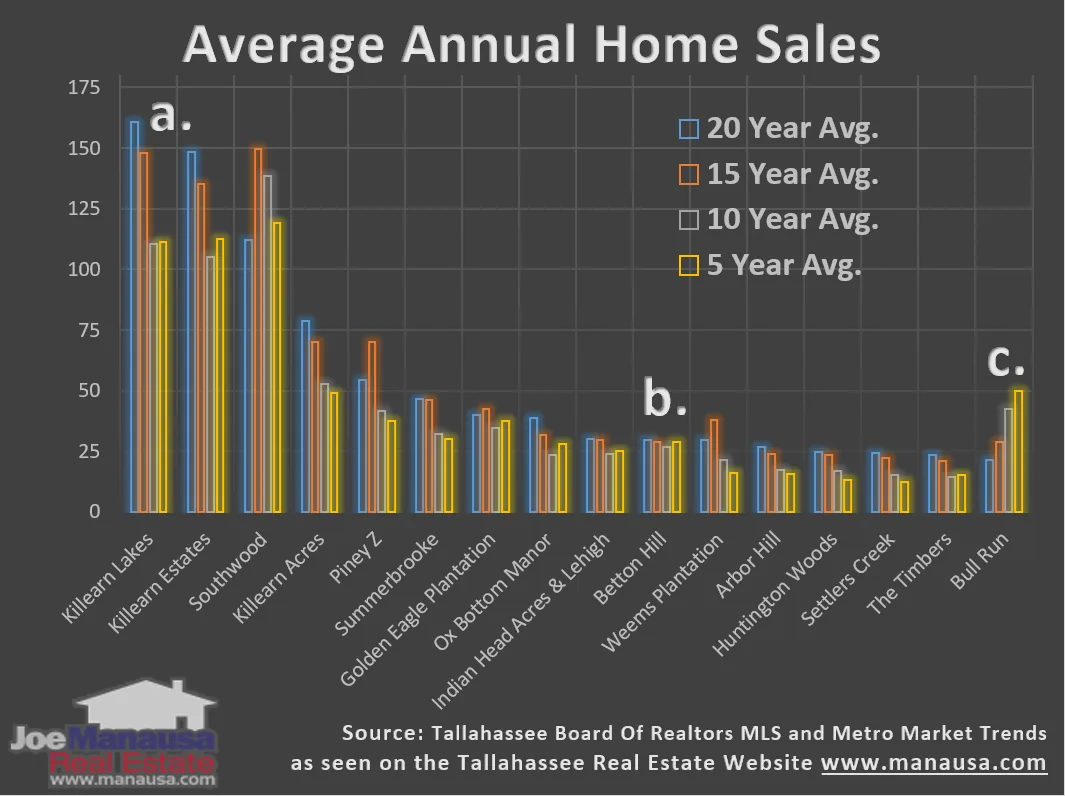
The top 16 neighborhoods, based upon the number of homes sold over the past twenty years, are shown in the graph above from left to right.
Each neighborhood contains four sets of average annual home sales data, from the twenty year average in blue down to the five year average shown in yellow.
Three different neighborhoods are identified above (a., b., and c.) in order to demonstrate what the data is showing.
Most neighborhoods in recent years are doing worse than their historical norm. When we look at “a.” which is Killearn Lakes, we see the progressive step-down over recent years. This is a sign that the neighborhood has not yet return to normal sales levels (thus we anticipate further growth in home sales in this neighborhood).
The next point “b.” shown Betton Hill, a neighborhood where unit sales were not greatly impacted by the housing market crash. I suspect that we can pretty much say that unit home sales in Betton Hill are back to normal, though home values are still recovering.
The final point “c.” shows the Bull Run neighborhood. At first blush, you might think that is was immune to the housing market collapse and is stronger than ever. In reality, this is just a case of a neighborhood that did not exist 20 years ago, so the “long-term” does not exist and new home construction has been ongoing over the past ten years.
This graph demonstrates the importance of having a sound understanding of the market in your area and your neighborhood.
The original one-page Weekly Special PDF is still available.
Get the Weekly Special Every Monday
Each Monday morning the Weekly Special takes one Tallahassee housing question, answers it with a chart of local sales, and explains what it means for your next move.
It is free, and you can unsubscribe any time.