
Weekly Special | February 3, 2020
Negative Equity Is Now Behind Us
Home values continue to surge higher, but we have not yet reached the high set 13 years ago.
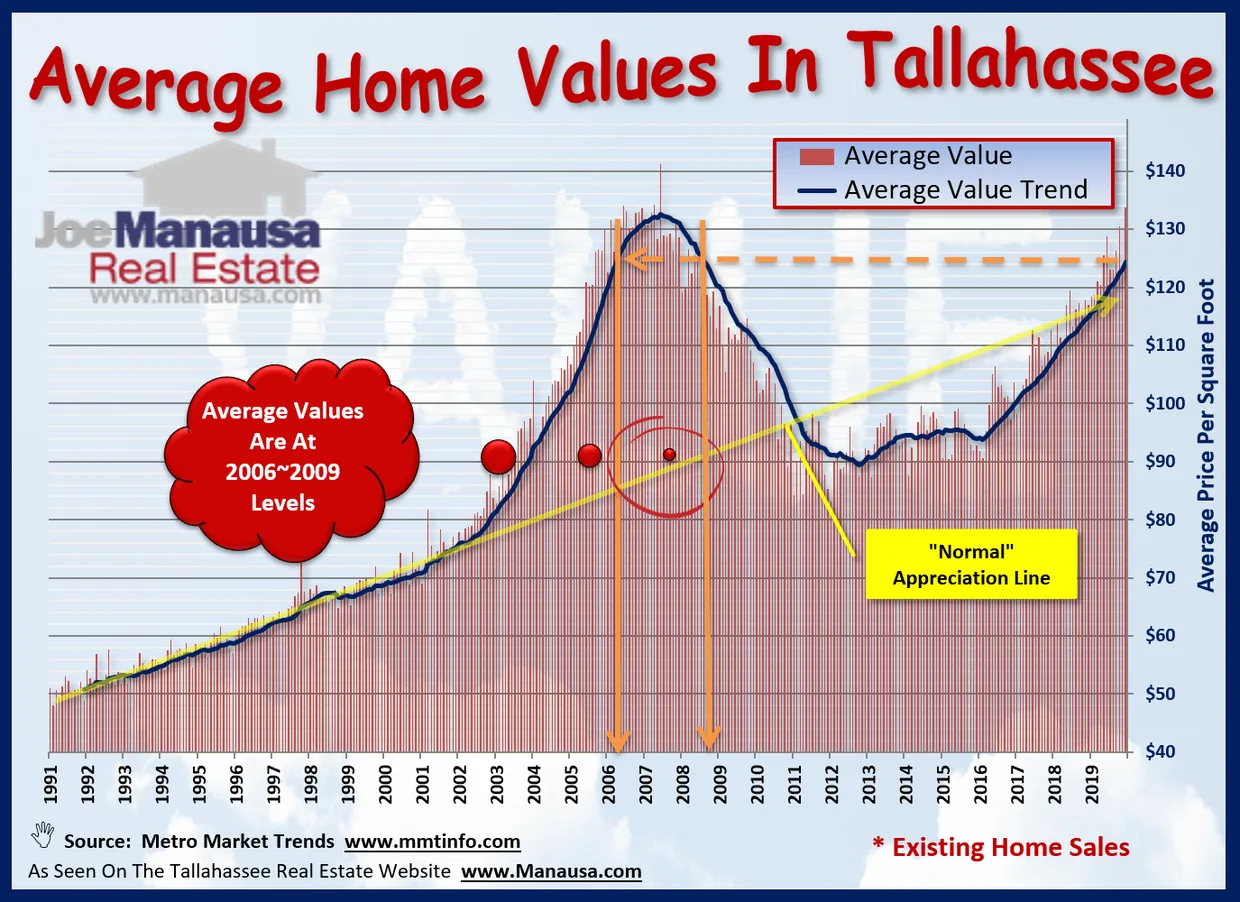
The graph above shows that the current home appreciation rate has been consistent for the past three plus years, but it shows so much more.
Currently, the average value of a home is the same as it was after the first quarter of 2006 (on the way up to the peak) and also the same as it was in the third-quarter of 2008 (on the way down from the peak). This means that people who purchased during that two and one half year span purchased homes for more than they are worth today.
Obviously, this is not good news for those homeowners, but the fact that we are getting closer to the peak is doing a lot of good for the Tallahassee housing market.
There are many homeowners who have wanted to make a move, but many have been trapped in zero or negative equity situations that have stopped them from moving.
Fortunately, there are very few people now who have market-related negative equity situations. Those that purchased during the peak have paid down their mortgages, and only those that have purchased or refinanced in the past two or three years might be upside down in their homes (which is normal due to closing costs).
The original one-page Weekly Special PDF is still available.
Get the Weekly Special Every Monday
Each Monday morning the Weekly Special takes one Tallahassee housing question, answers it with a chart of local sales, and explains what it means for your next move.
It is free, and you can unsubscribe any time.